There’s more beneath every candle.

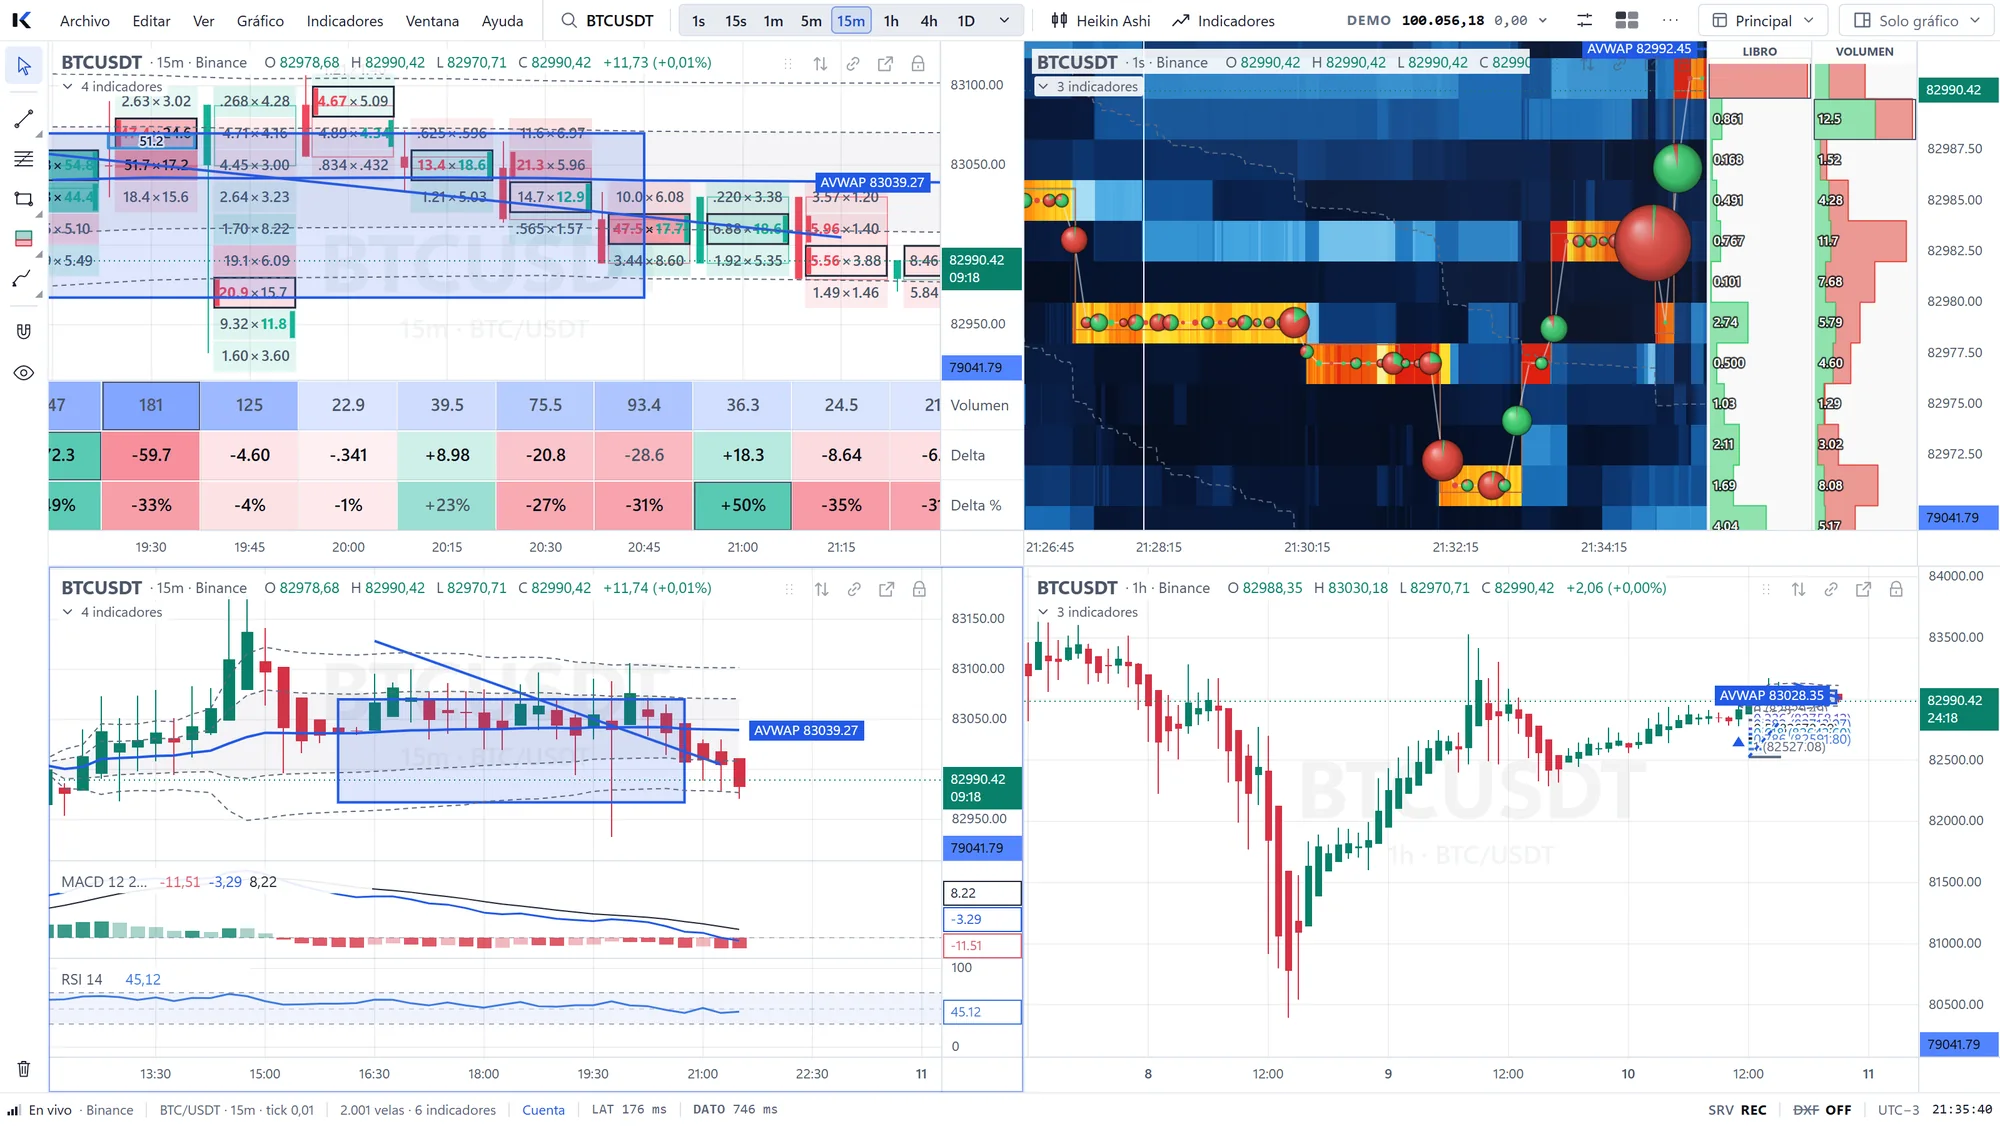
Kairos shows you the market from the inside: professional charting, order flow and execution in one native terminal. Full order book, liquidity heatmap, footprint, DOM and backtesting, on a charting engine written from scratch.

What you see behind this isn’t a video: it’s the real BTCUSDT order book from October 2, recorded by Kairos and redrawn in your browser at 3x. Further down, the same engine, live.
BTCUSDT — Book — levels Trades/s — Book updated — Buys/sells last minute —
Kairos — Main · BTCUSDT
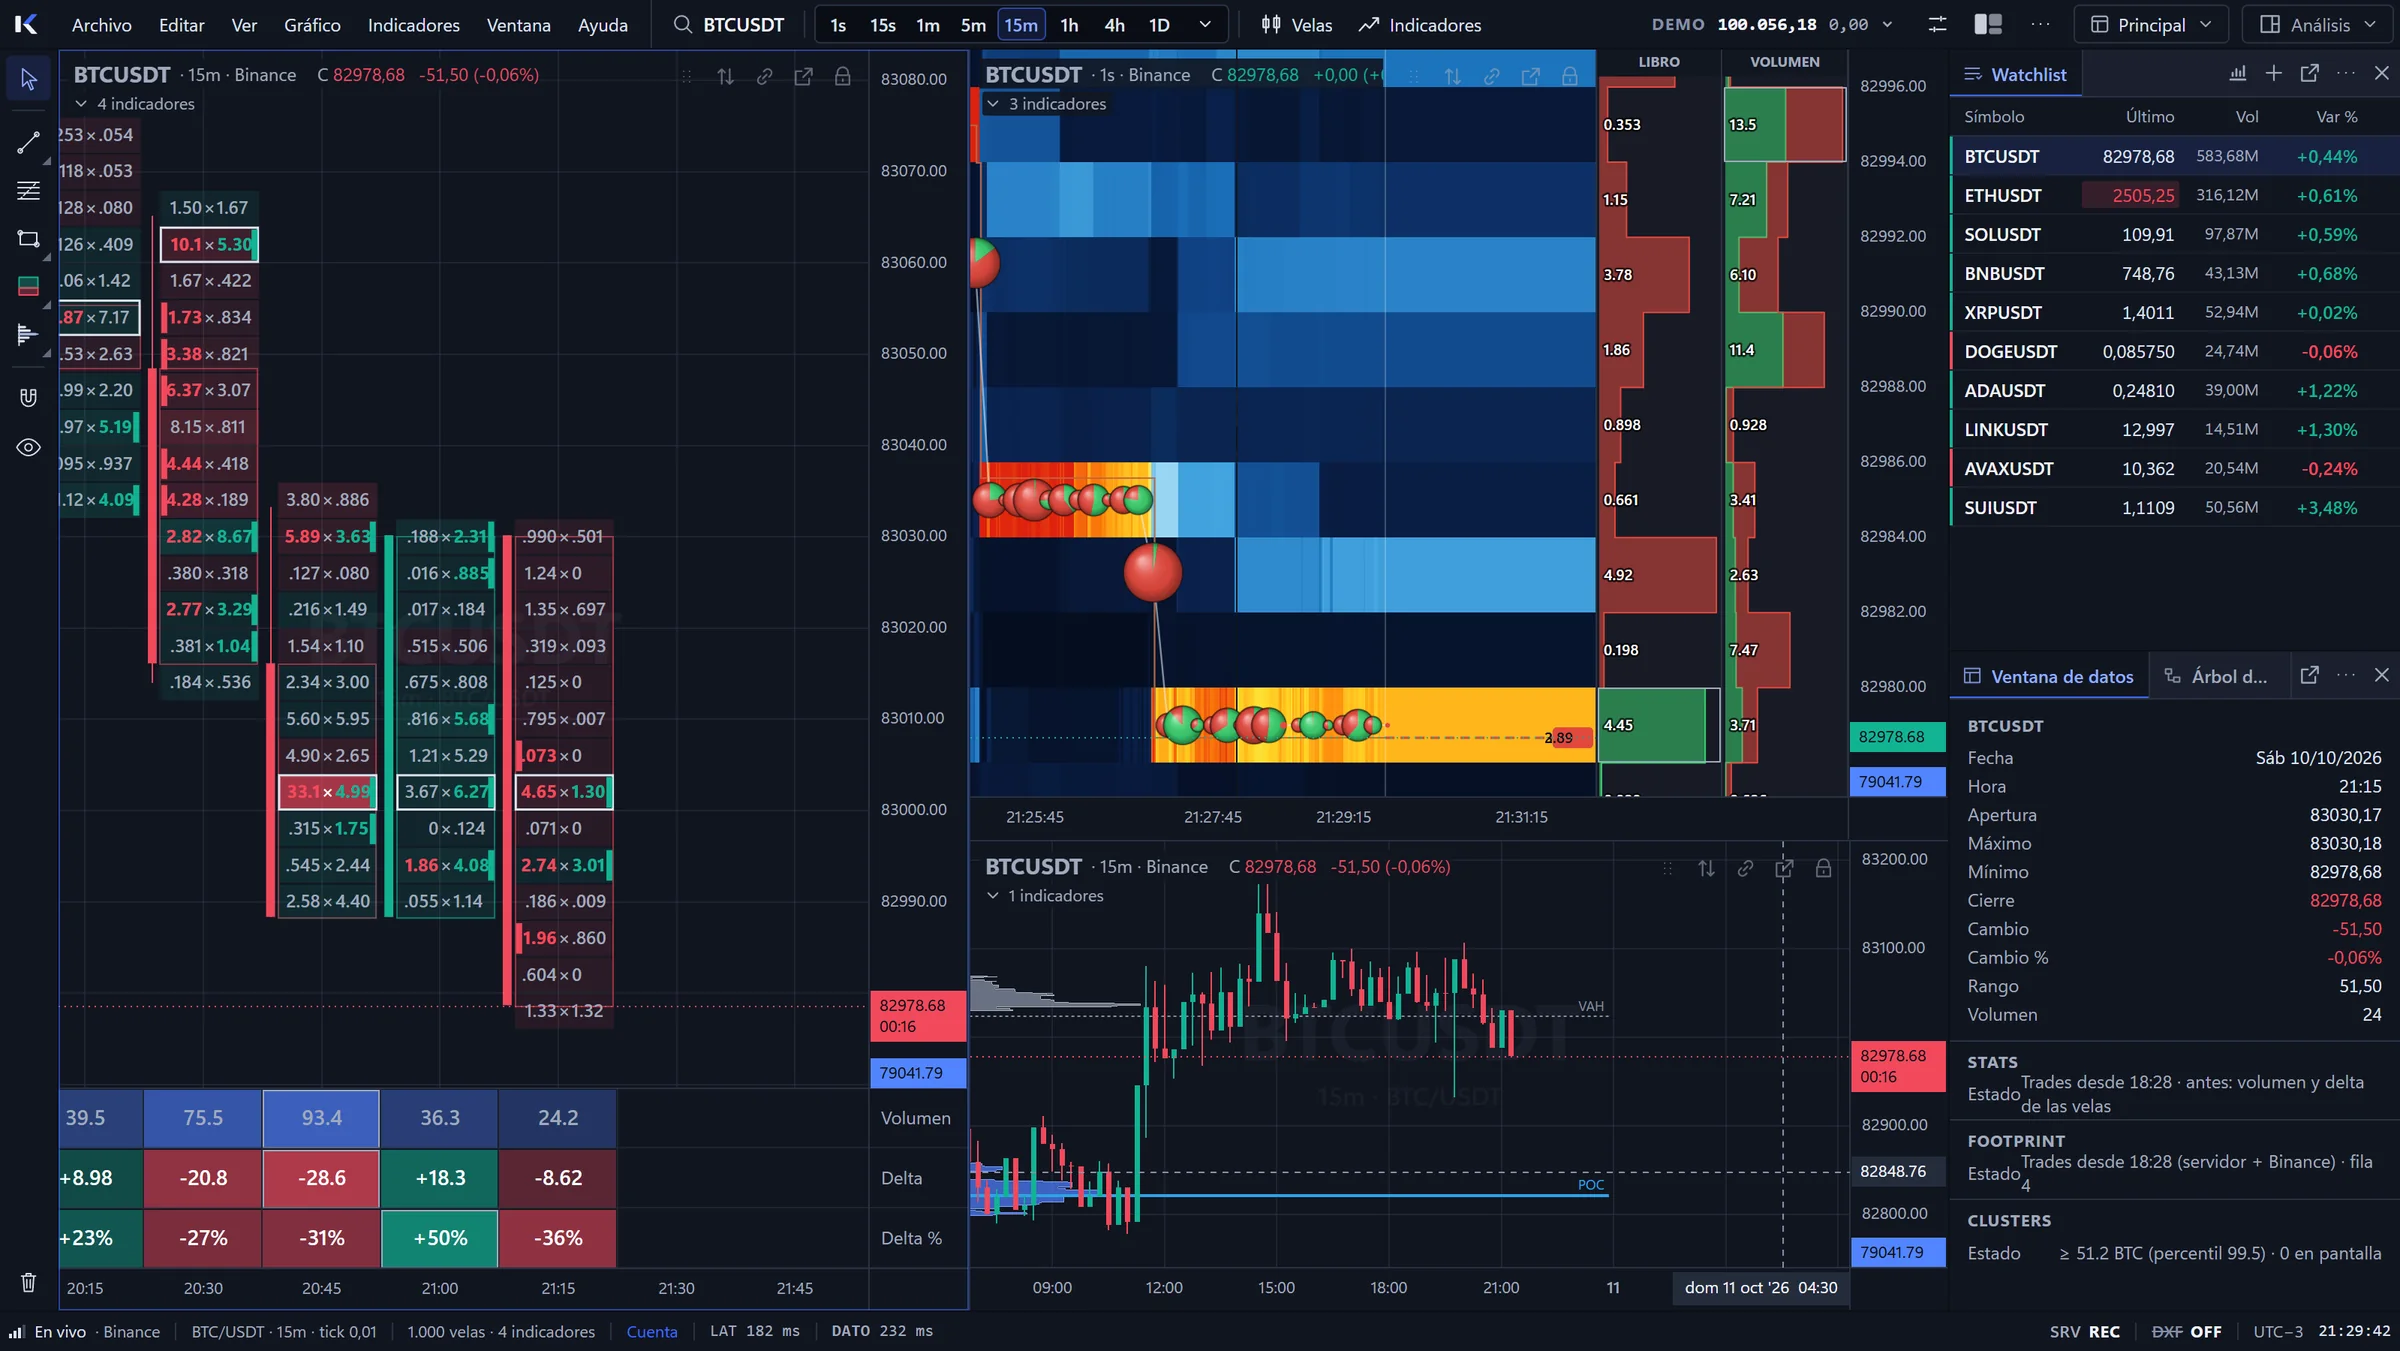
Kairos: 15-minute footprint, 1-second liquidity heatmap with book and volume, session profile, watchlist and data window
Beneath every candle

See what candles can’t show.

01

BTCUSDT, October 2, 04:20 UTC. In candles: ten minutes of price, and that’s all.

02

Beneath, the book: each row is a price and the color is how much liquidity was waiting there. You see the walls coming, and you see them vanish.

03

On top, the aggression: each bubble is volume traded in 3 seconds, green buys and red sells. Now the candle has an explanation.

0
third-party charting libraries: the engine is our own
5.000
book levels per side, synced every 100 ms
60 fps
at your monitor’s native refresh rate, GPU-rendered
1–8
synced charts in one workspace
617
automated tests over engine, data and trading
Why order flow

A candlestick chart tells you what happened.
Kairos shows you why.

Price moves because someone buys or sells urgently against orders that were waiting. Those three layers are always there; most platforms only show you the first one.

Layer 1 · The result

Candles

Open, high, low and close of each period. A useful summary, but it comes late: it doesn’t say who pushed, or against what.

Layer 2 · The intention

Order book

Limit orders waiting at each price. Big "walls" stop price or pull it in, and sometimes vanish before it gets there. The heatmap shows their history.

Layer 3 · The aggression

Order flow

Who crossed the spread: buyers lifting the ask or sellers hitting the bid. The footprint breaks it down price by price inside each candle.

Kairos draws all three layers at once, in sync, on the same chart.

Live demo · try it right here

What waits beneath every candle.

A minimal version of the Kairos engine, written for the browser and wired to the real market: Binance’s full book (5,000 levels plus updates every 100 ms) and every trade, while this page is open.

…
Click to interact · wheel: zoom · Shift + wheel: price zoom · drag: pan

Oct 2 session: real BTCUSDT book and trades recorded by Kairos, replayed at 2x. Live: Binance public data right now, no accounts or keys (if your network blocks Binance, it switches to a simulated market and says so).

Auction Market Theory

Read the auction,
not just the price.

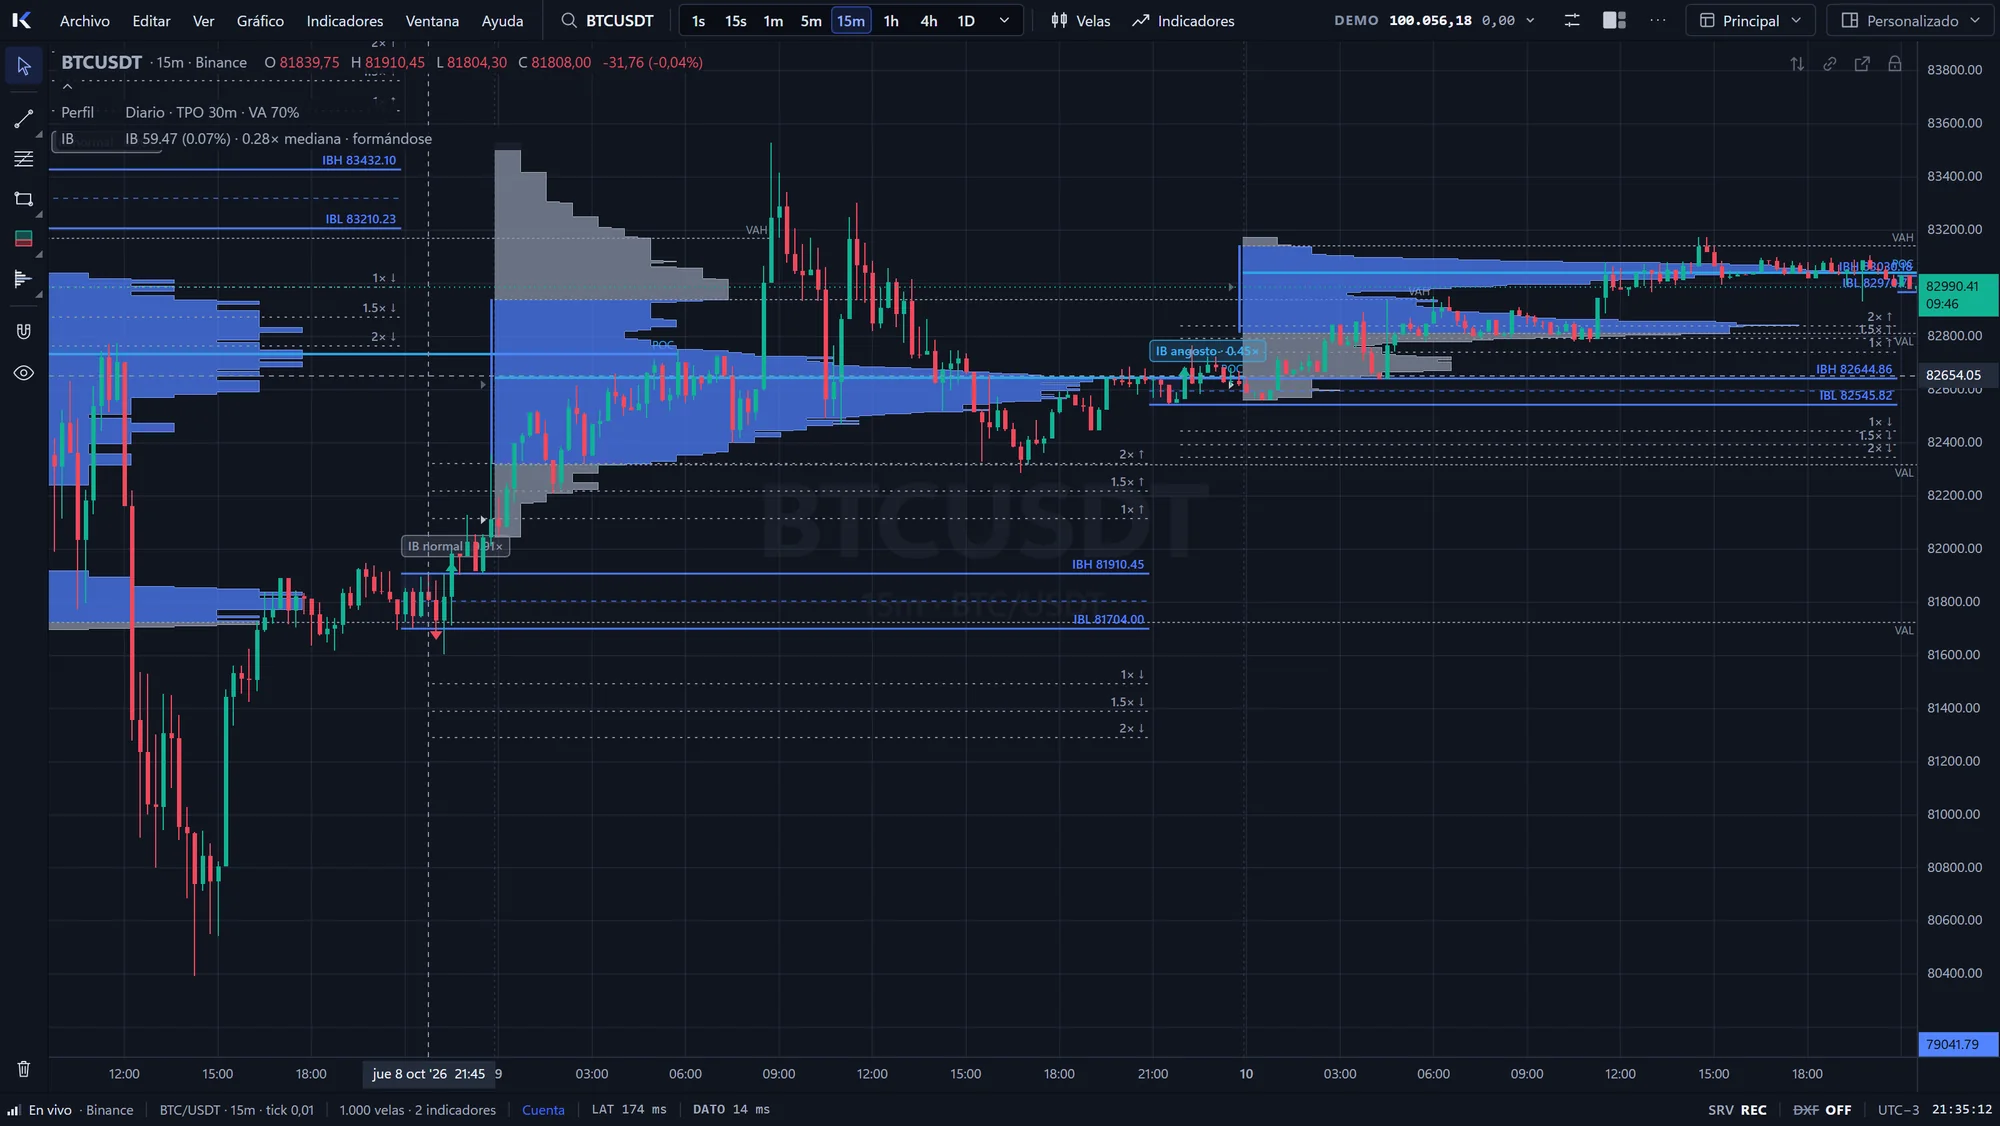
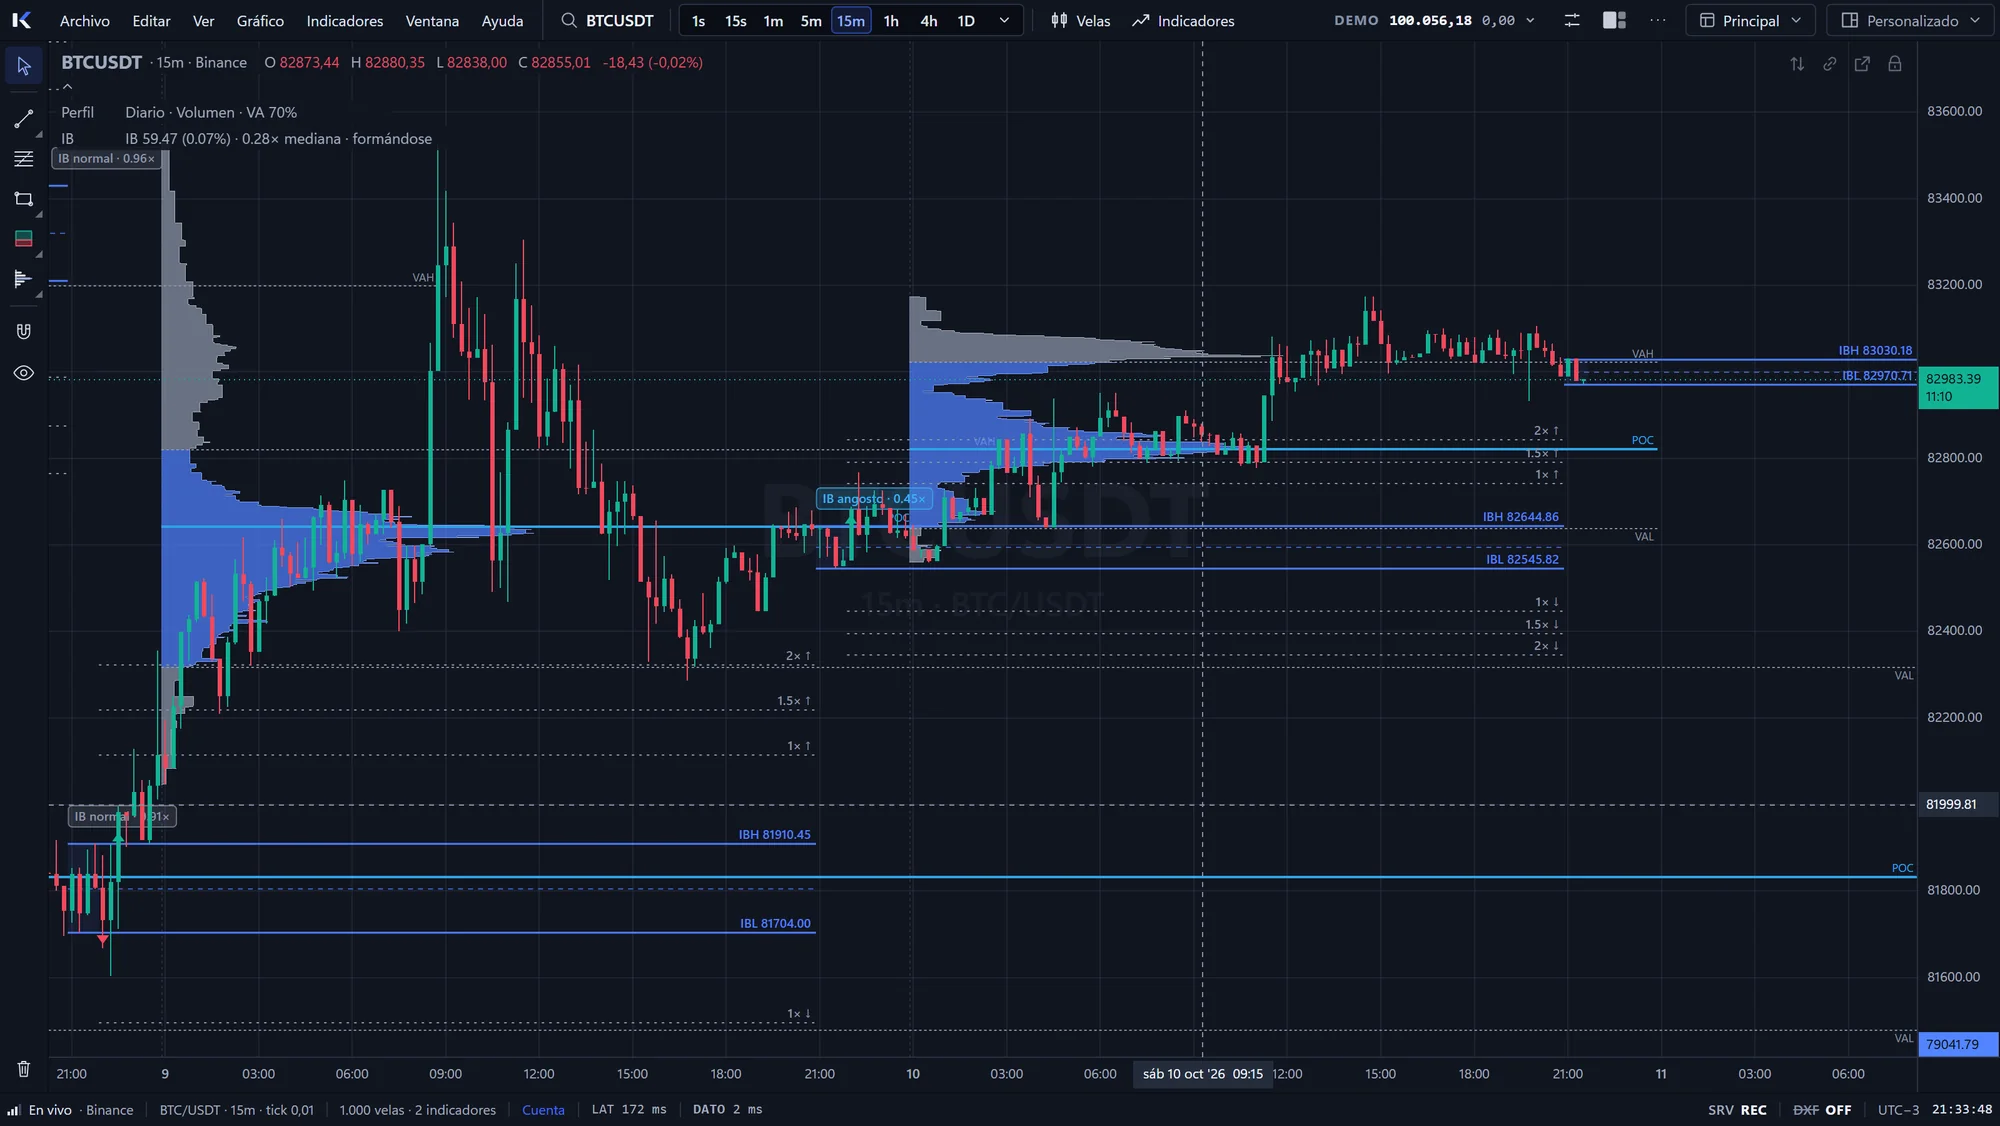
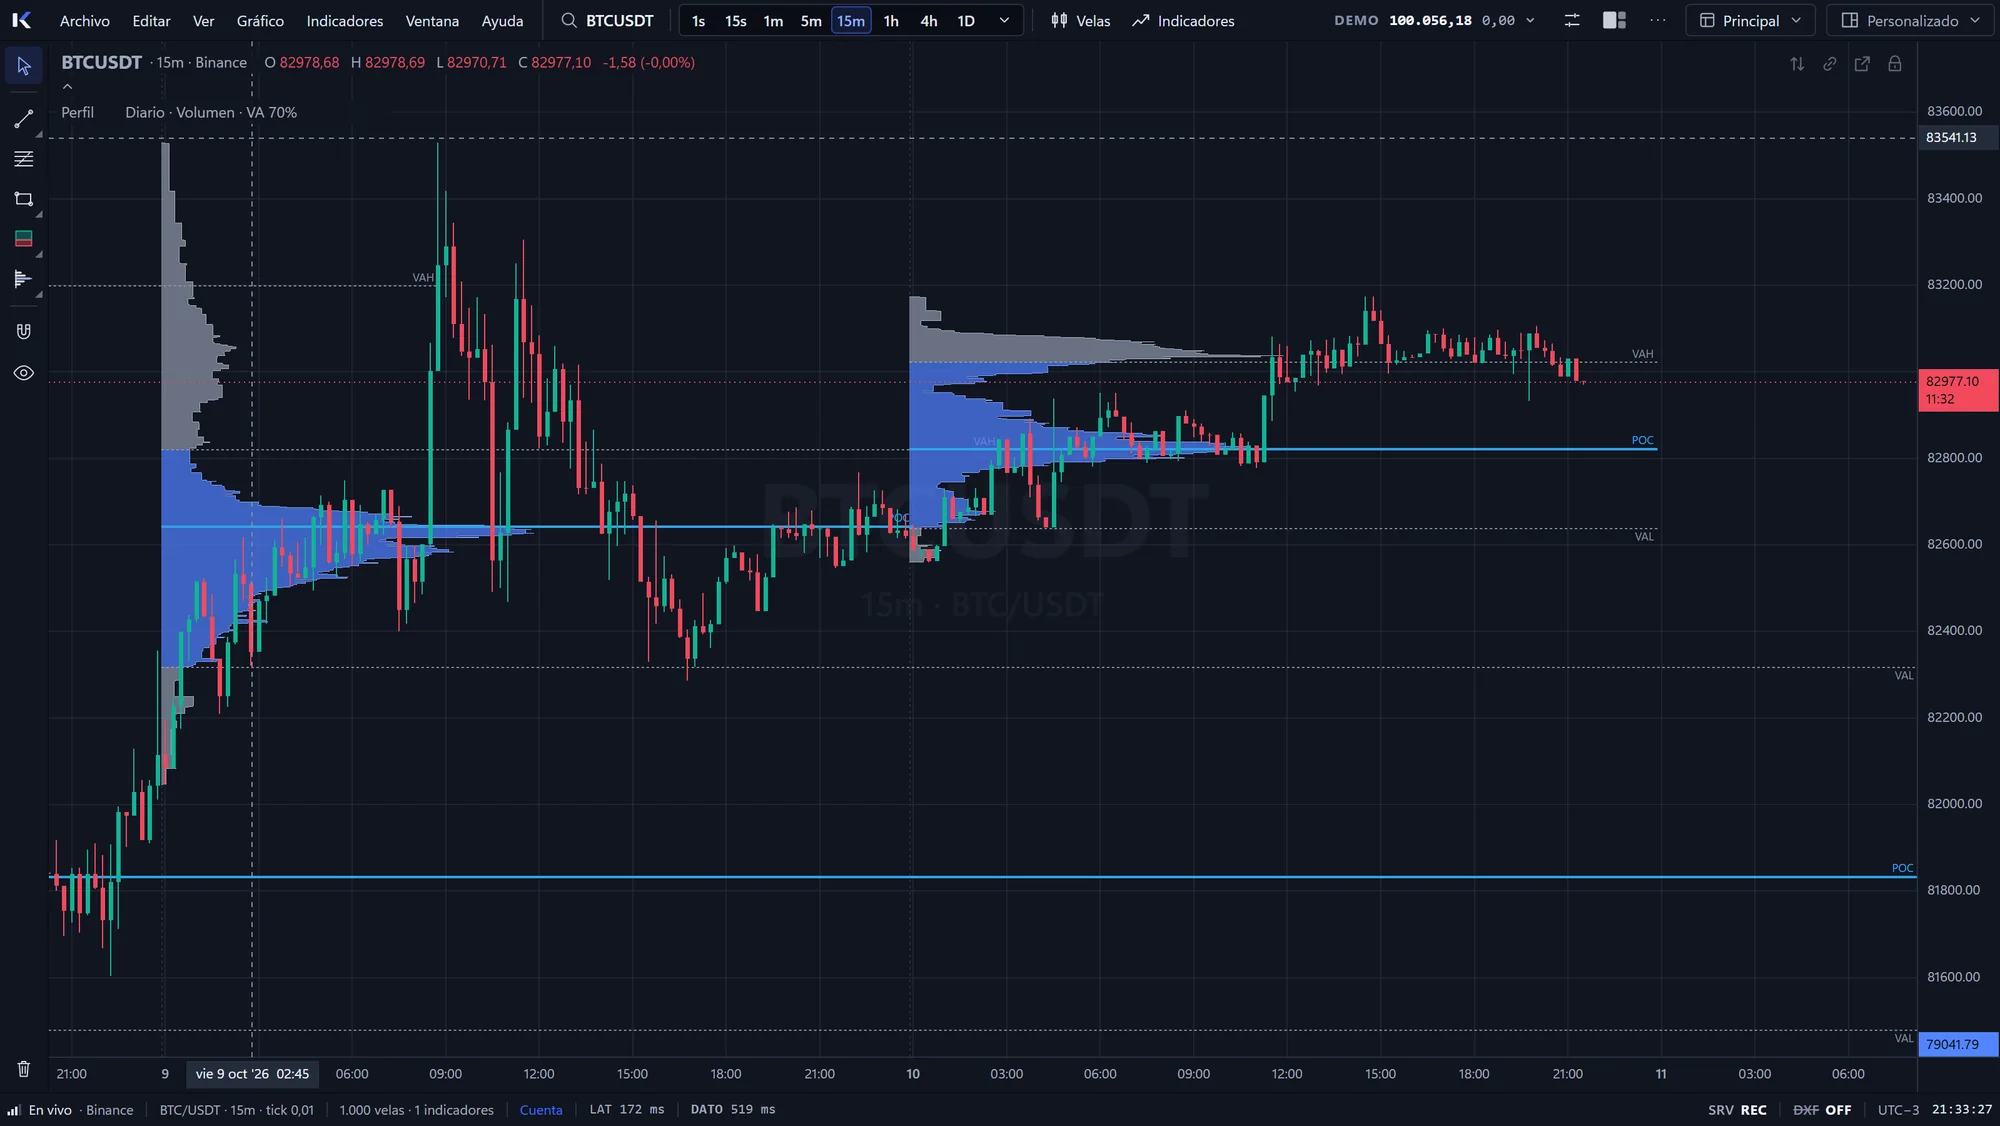
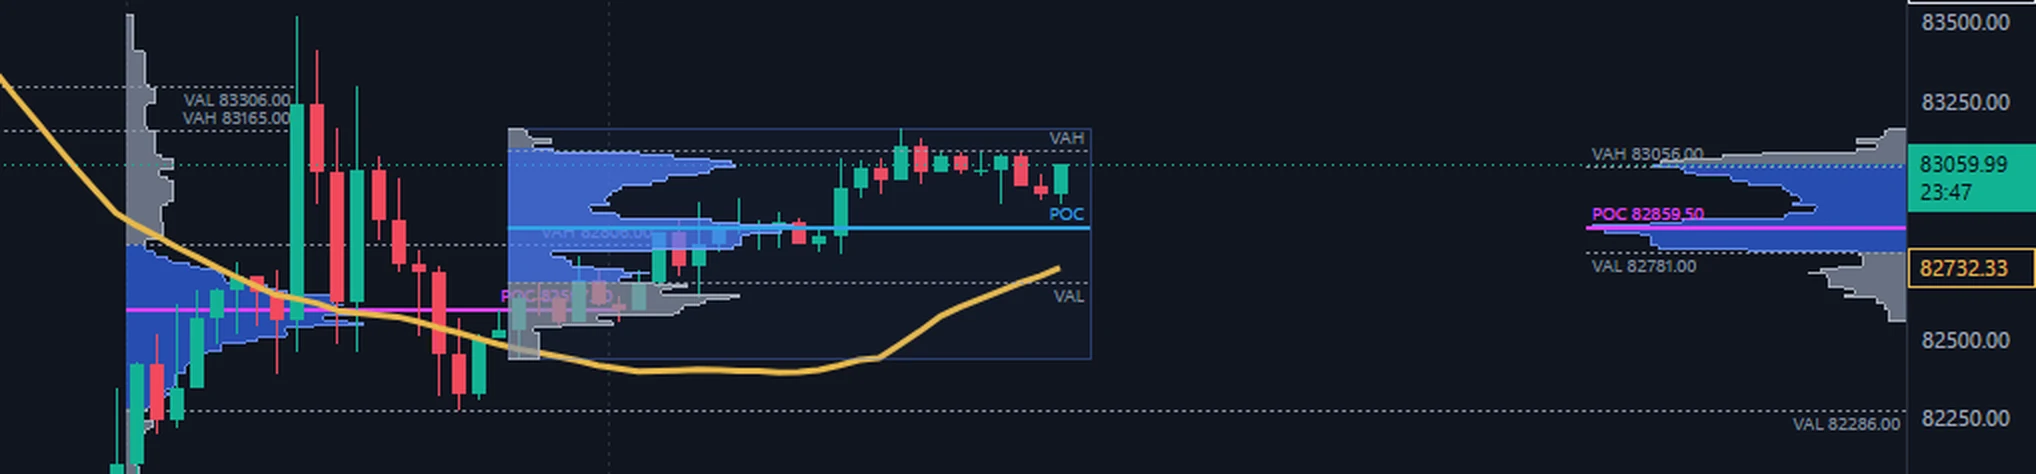
Highly configurable Volume Profiles and TPO for AMT trading: where the market accepted price, where it rejected it and where value is. Every profile is a module you combine with any chart, interval or indicator.
  • Session Volume Profile
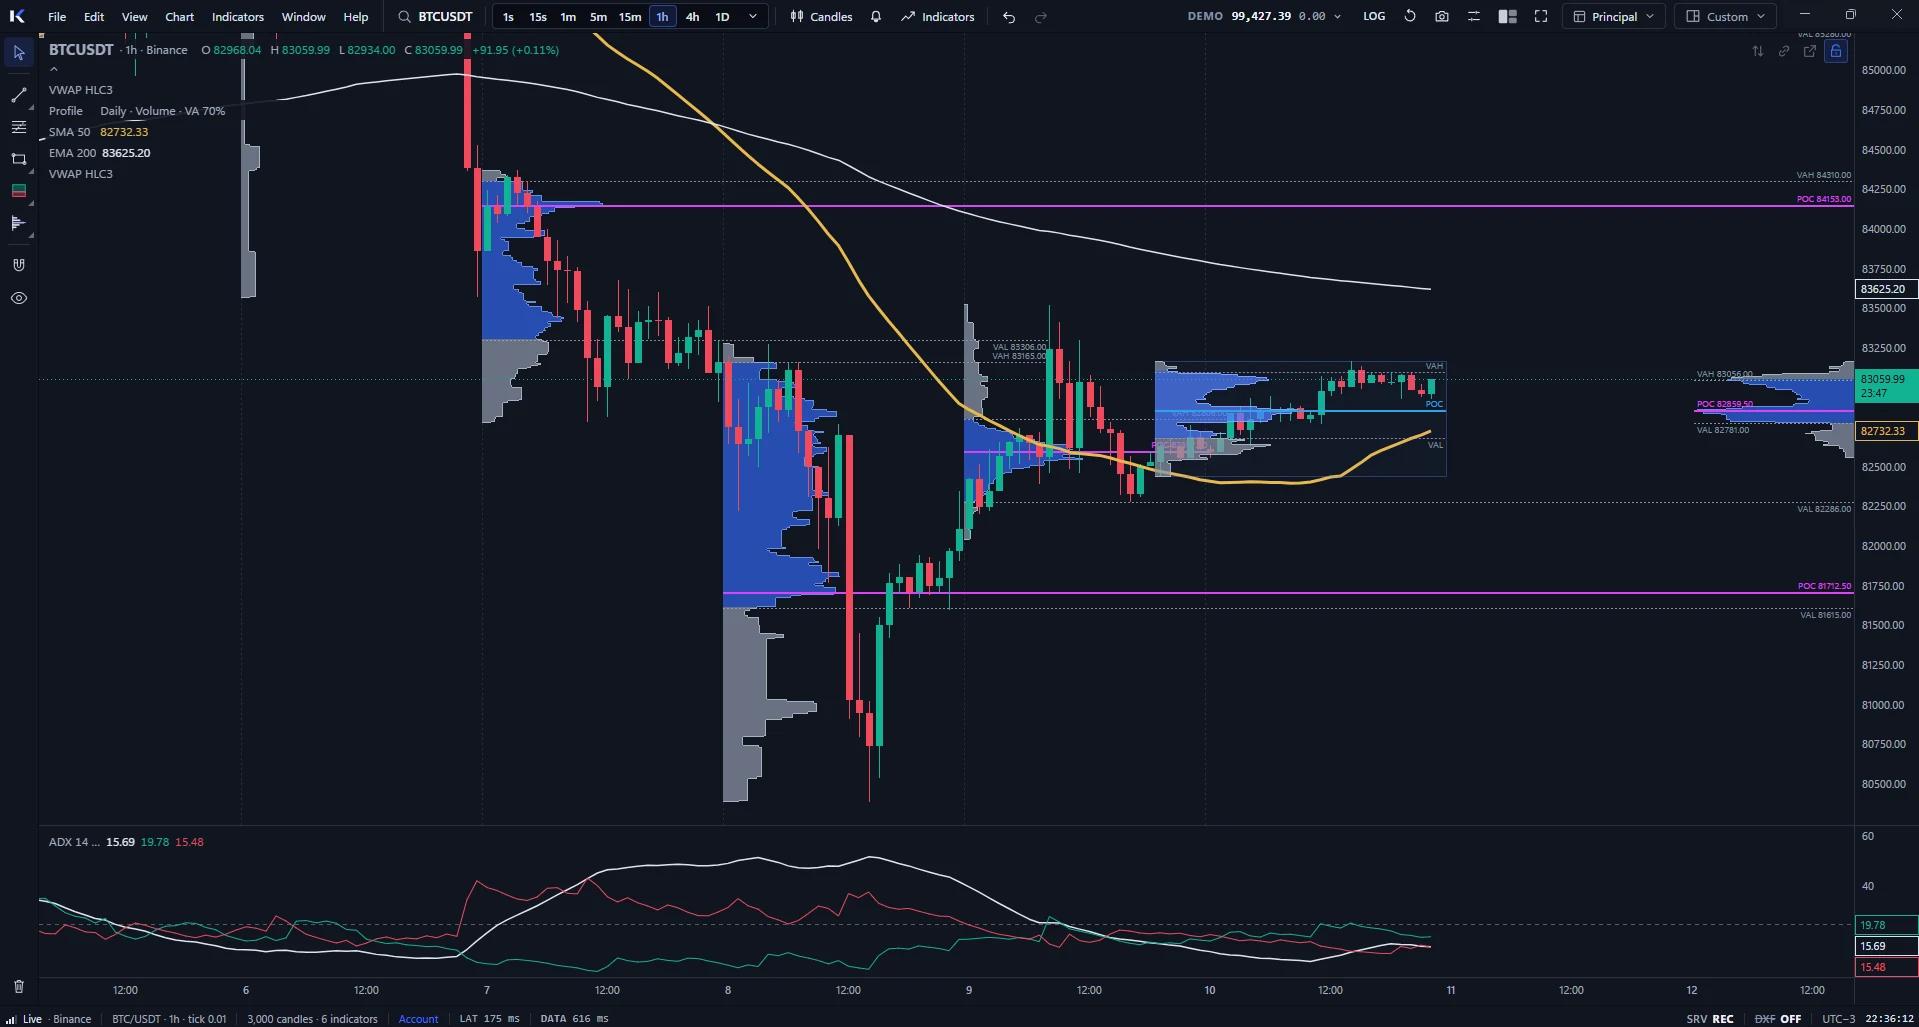
    One profile per session (daily, weekly, monthly, 4 h or 1 h) with a 70% value area, POC, VAH and VAL. Levels extend always, or as naked POCs until price comes back to touch them. Built from real recorded trades when coverage exists.
  • Anchored profiles and right-docked session
    The Range Profile tool anchors a VP or TPO between two points on the chart and moves like any drawing. The current session can live docked to the right edge, developing live while you look at the rest of the chart.
  • TPO / Market Profile
    30-minute periods as letters or bars, colored by session time or by value area, with a value bracket and open and close marks. Letters appear on their own when there is room to read them.
  • Initial Balance
    IBH and IBL with 1x, 1.5x and 2x extensions, and a narrow, normal or wide classification against the median of previous sessions, to know what kind of day is forming.
  • Highly configurable
    Total, buys | sells, delta or volume + delta; bars or letters; width, opacity, colors and ready-made presets. Rows are always one tick: zooming never moves the POC or the value area.
Auction Market Theory · BTCUSDT
Daily volume profiles, anchored profile and right-docked session profile Anchored profile and right-docked session profile Session TPO with Initial Balance Initial Balance with extensions Session volume profile

VAH · VAL · POCnaked POCVA 70 %TPO 30 minIB 1x · 1.5x · 2xreal volume
Charting

A charting engine,
built to measure.

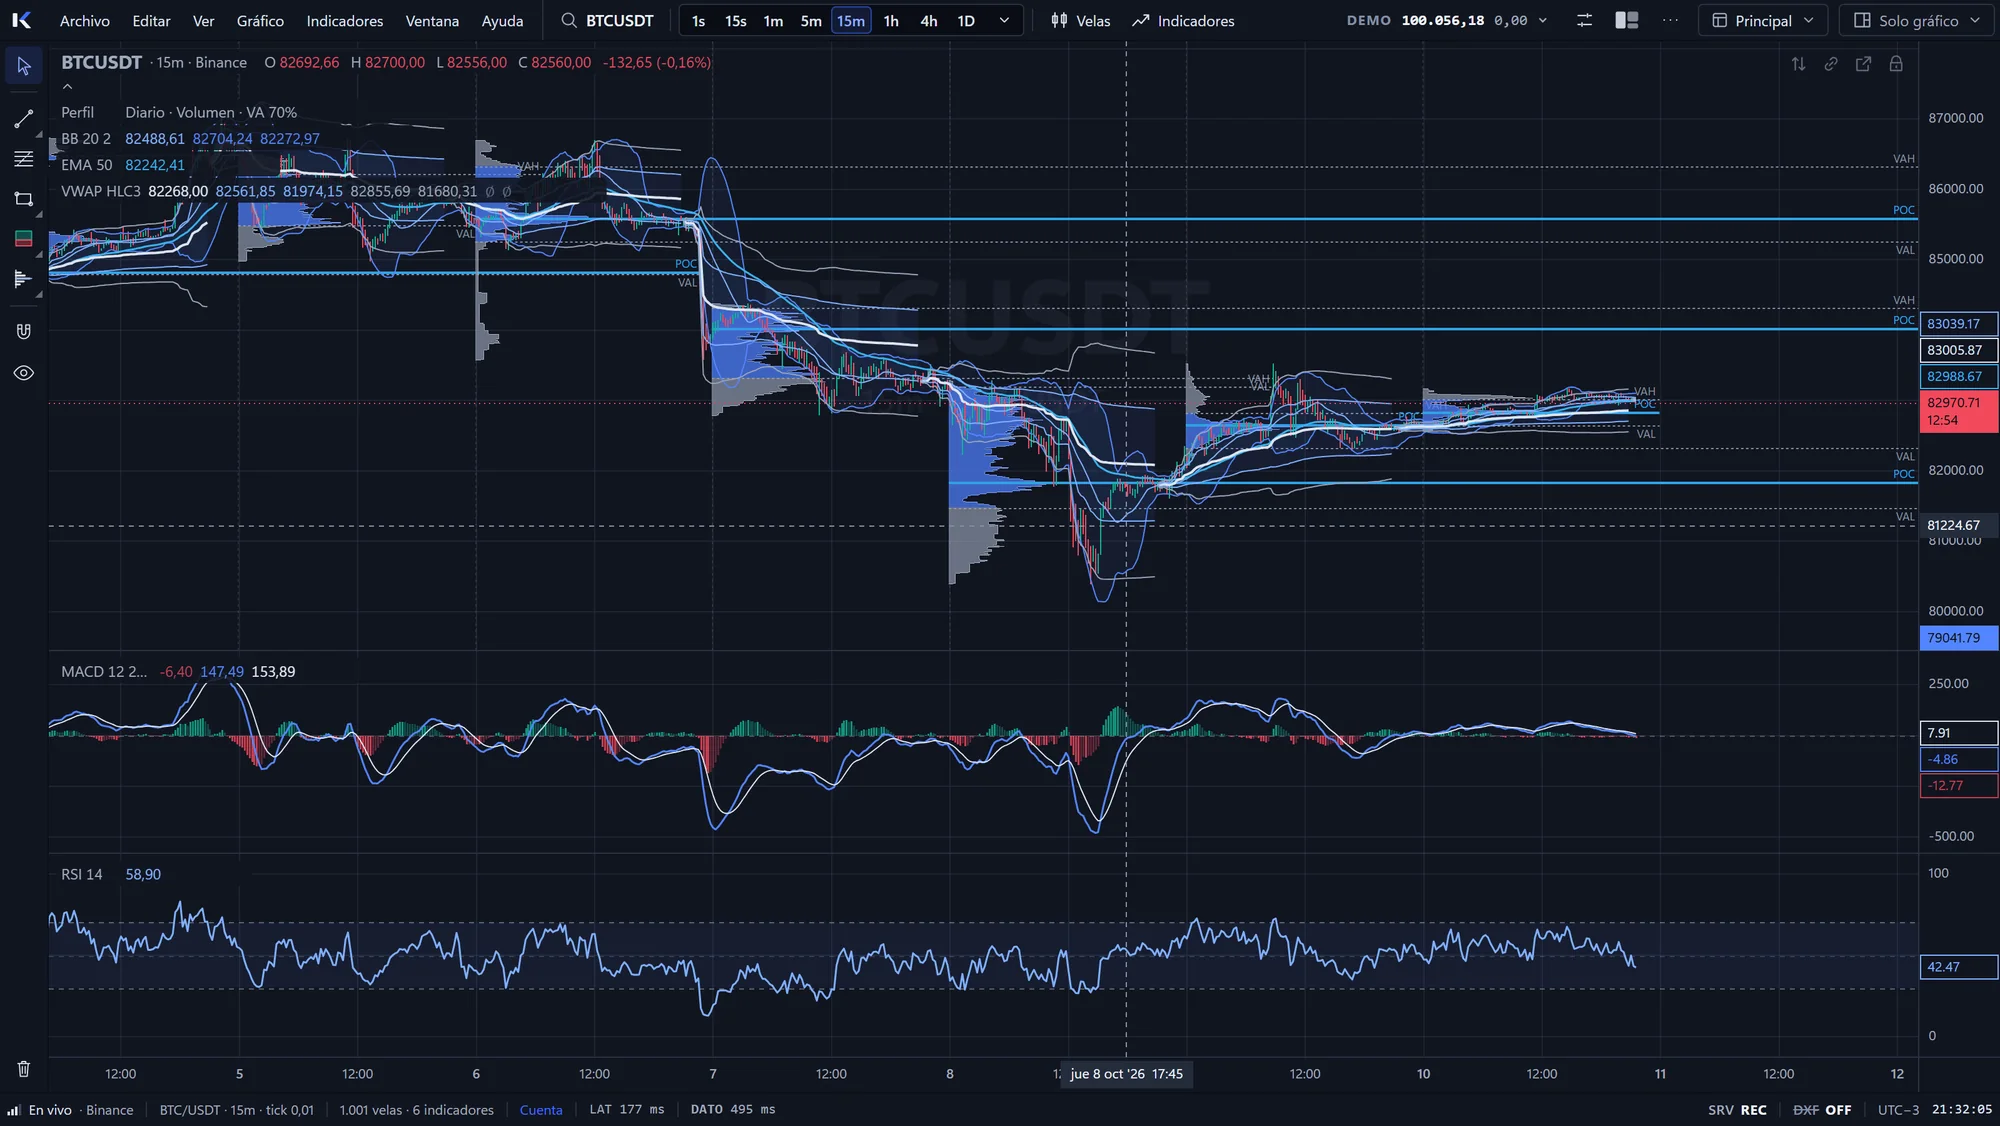
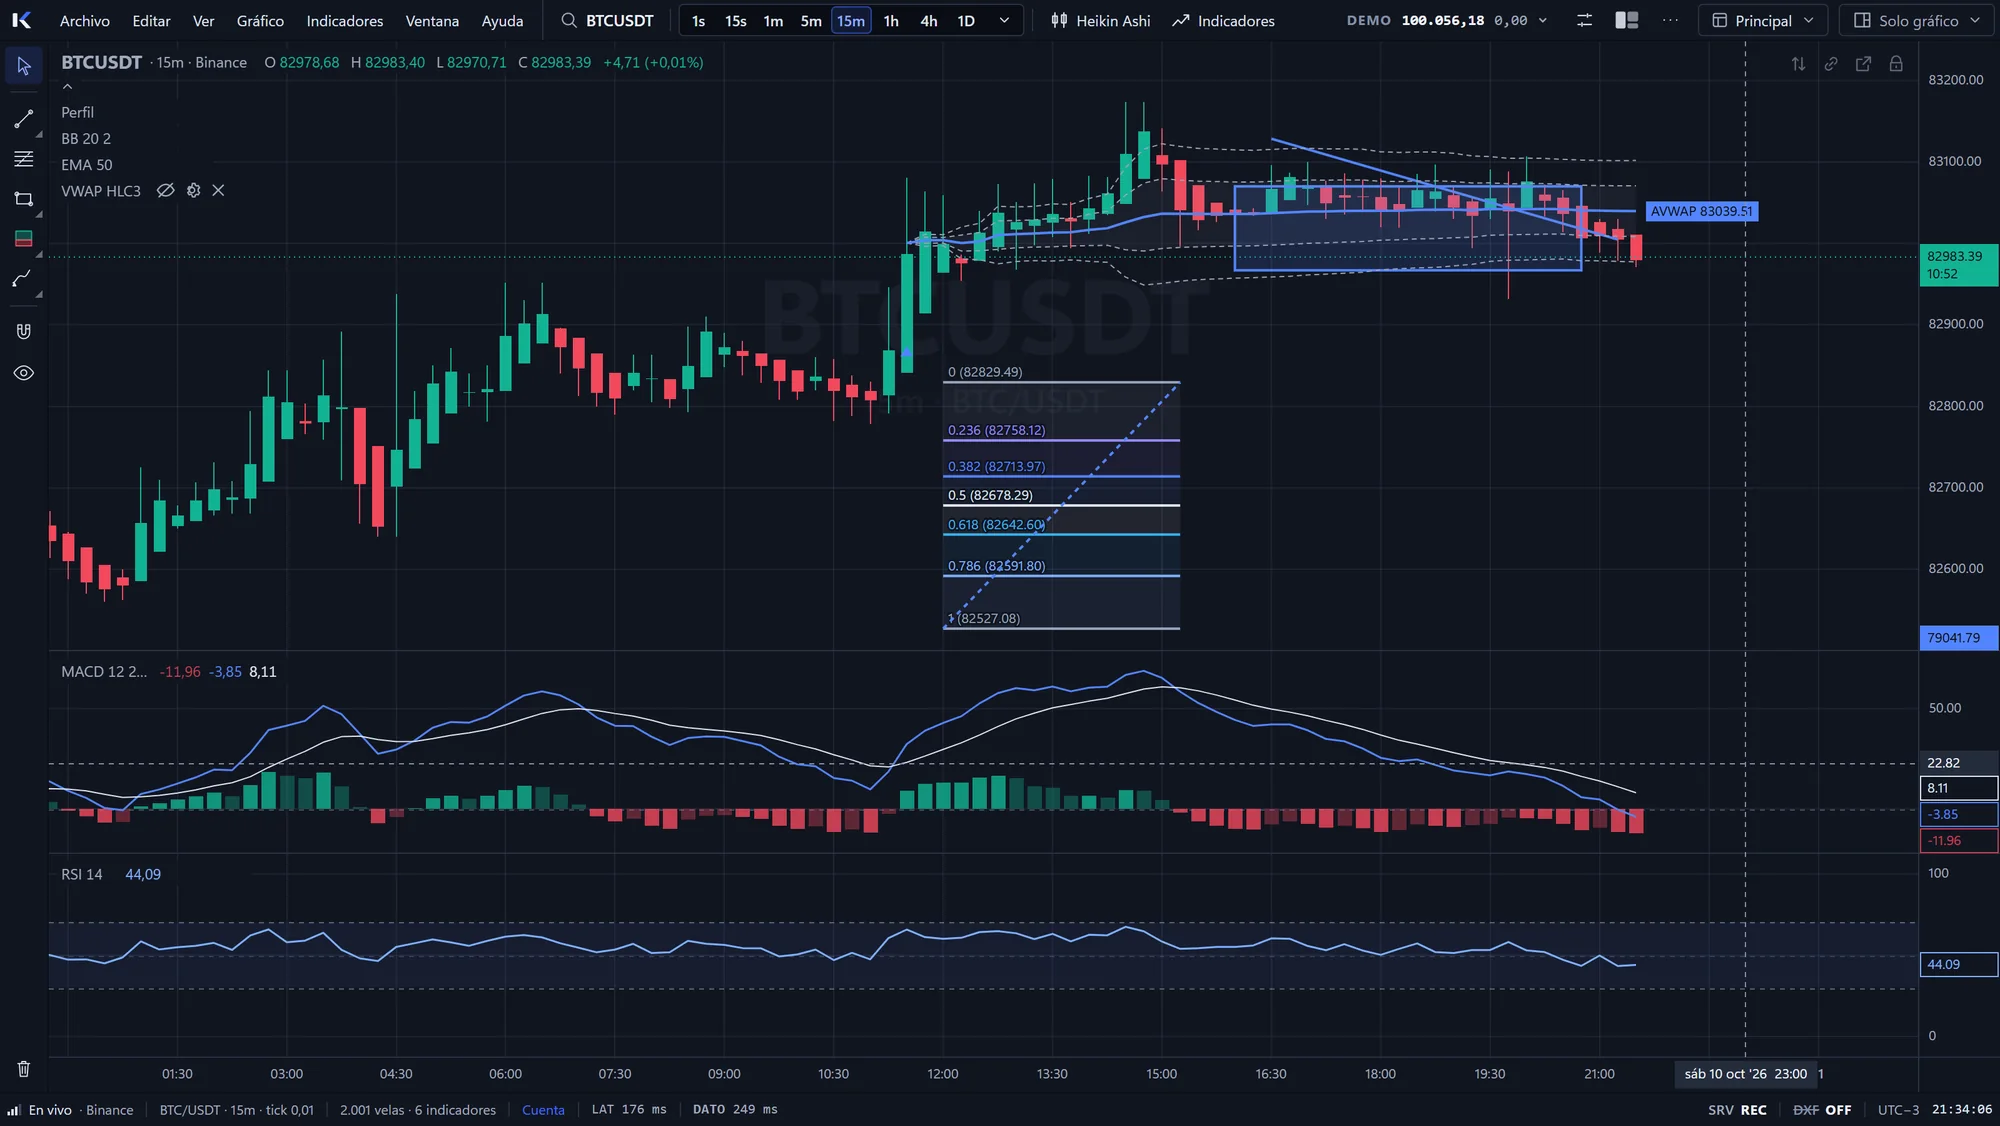
No embedded TradingView, no charting libraries: scales, rendering, interaction, indicators and drawings are our own code, built to move tens of thousands of bars with order flow layers on top.
  • Indicators in panes
    Anchored VWAP with ±1/2/3σ bands, Bollinger, EMA, SuperTrend, ADX, RSI, MACD, MFI, CMF, RVOL and more. Each one is a pure function with typed parameters, per-line styles and editable levels.
  • Drawing tools
    Trend lines, rectangles, Fibonacci, anchored VWAP, measurements and positions. They anchor to time and price, so they survive interval changes and loading more history.
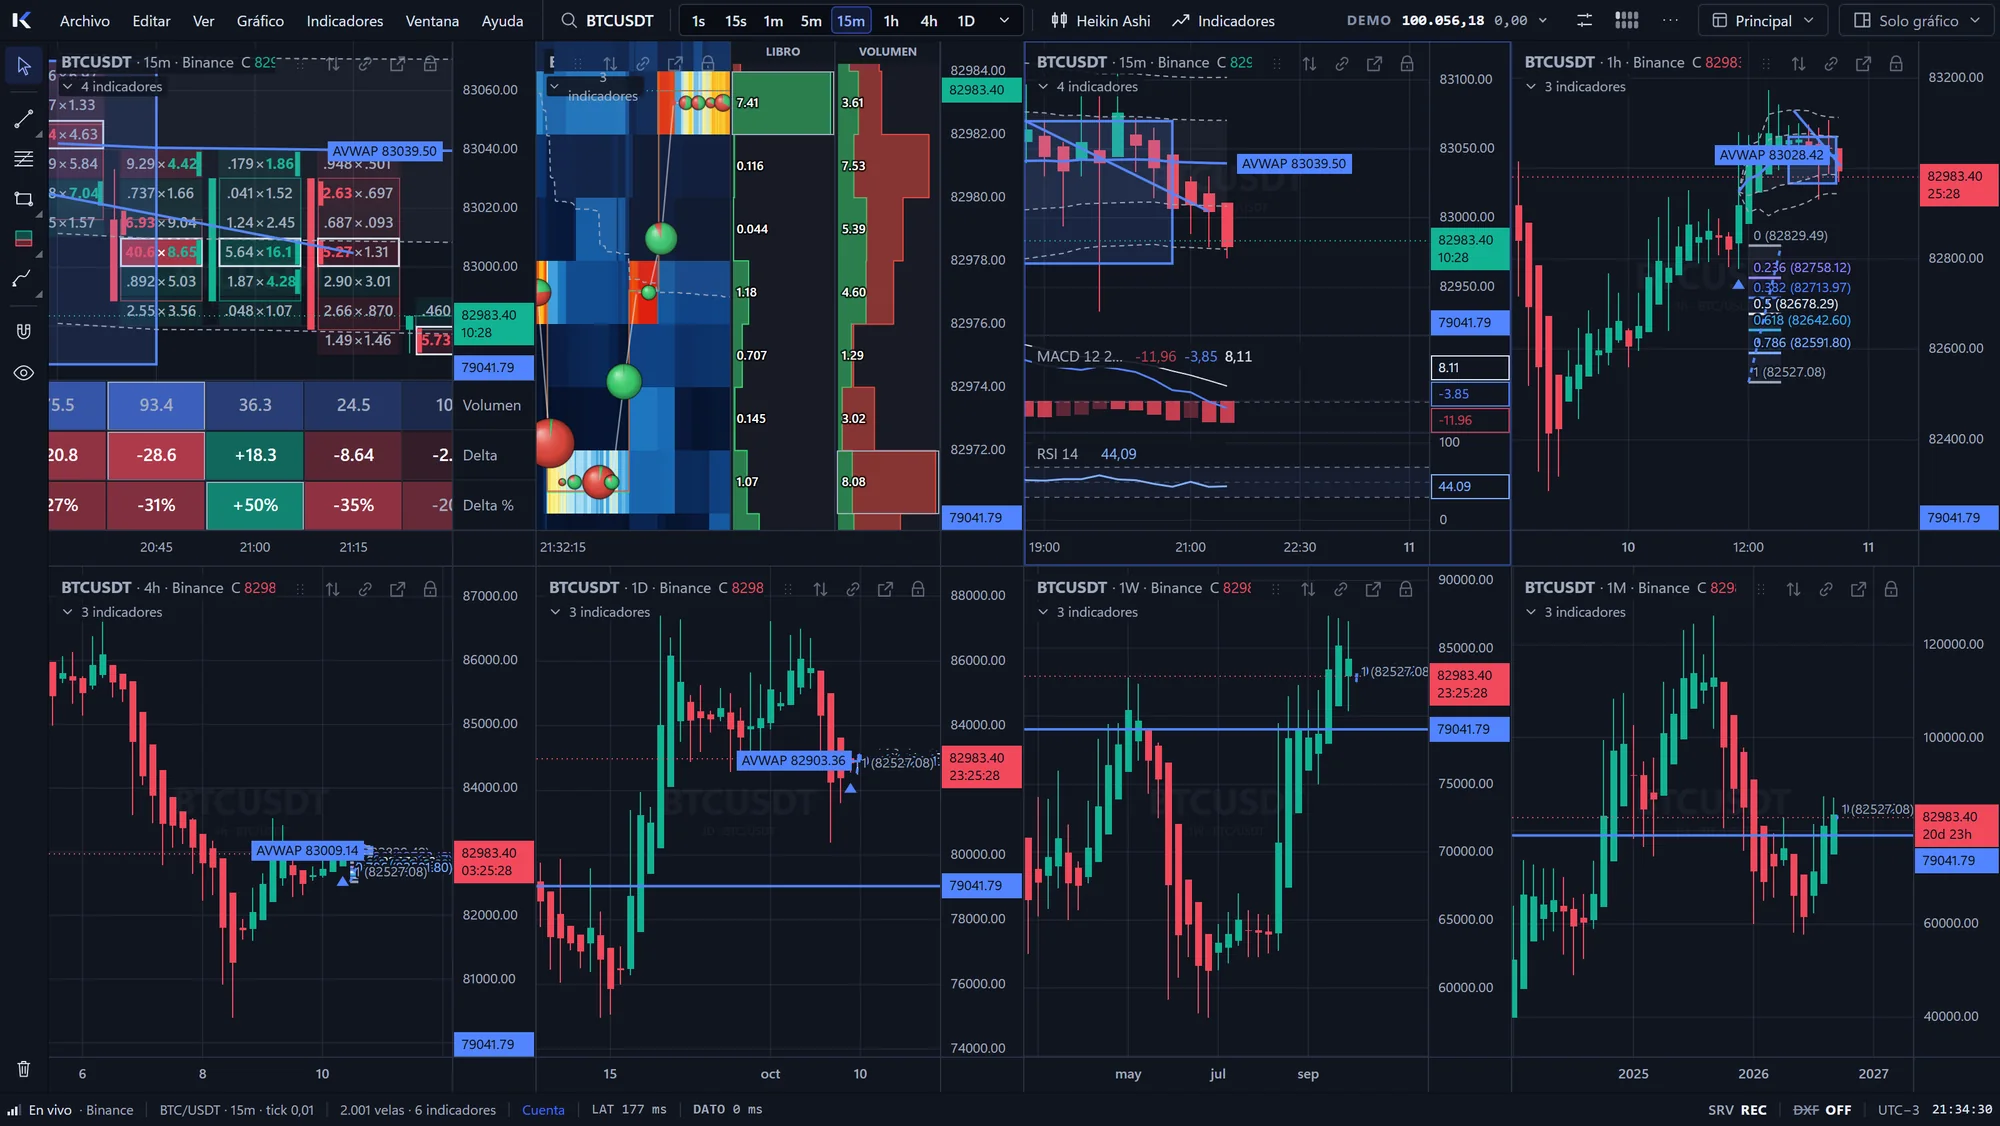
  • Up to 8 synced charts
    Grids of 1 to 8 charts with linkable symbol, interval and crosshair. Any panel can be popped out to another window or monitor.
  • Themes and workspaces
    Dark, Midnight and Light, candle colors to taste, and named workspaces that keep layout, indicators and drawings.
  • Searchable catalog
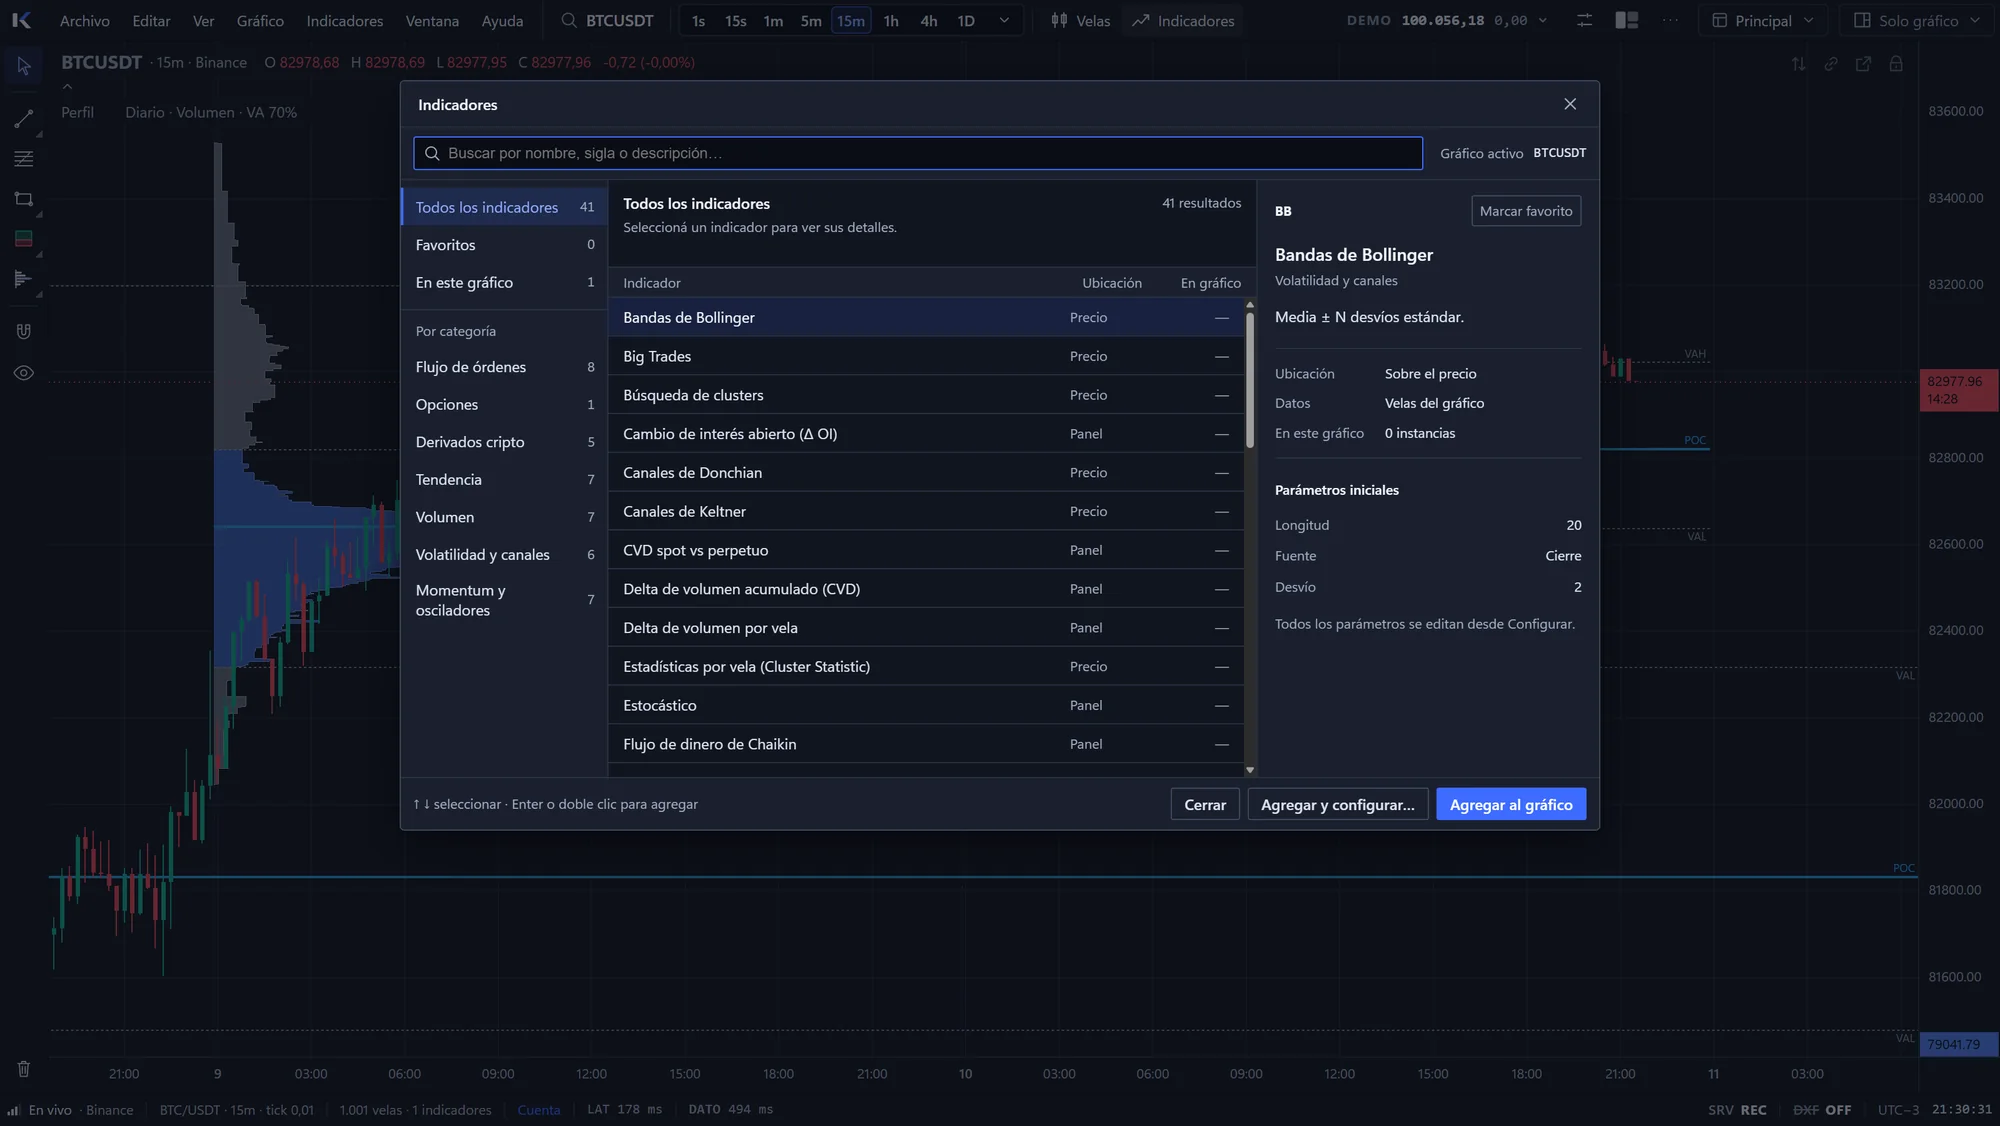
    Word search in Spanish, English and aliases, favorites, and an inspector with description and parameters before adding.
Charting · BTCUSDT 15m
Chart with daily profiles, Bollinger, EMA, VWAP, MACD and RSI Drawing tools on the chart Eight synced charts Light theme with four charts Indicator catalog

Execution

From analysis to order
in one click.

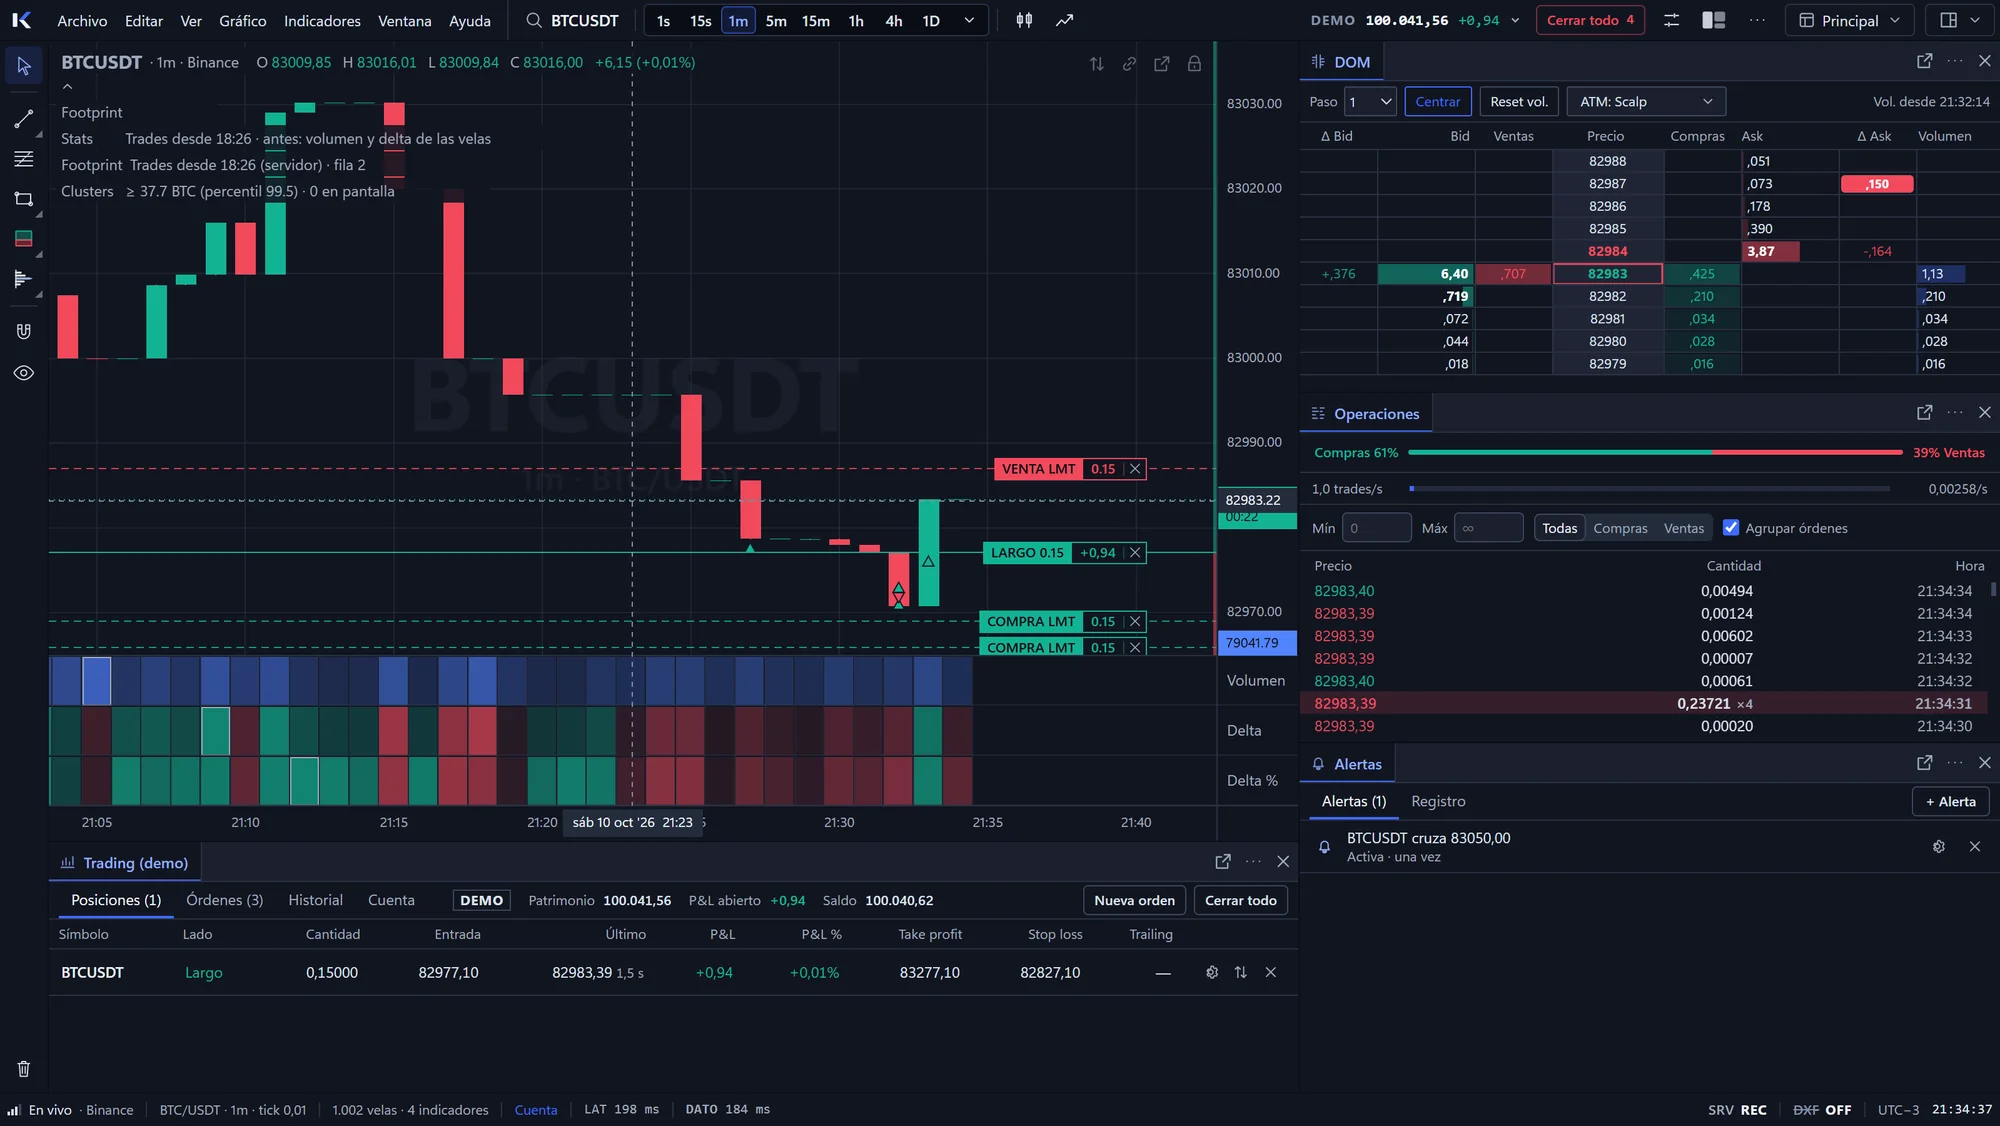
A full demo account to practice against the real market: orders from the chart, the DOM or the heatmap, automatic brackets and a log of every fill.
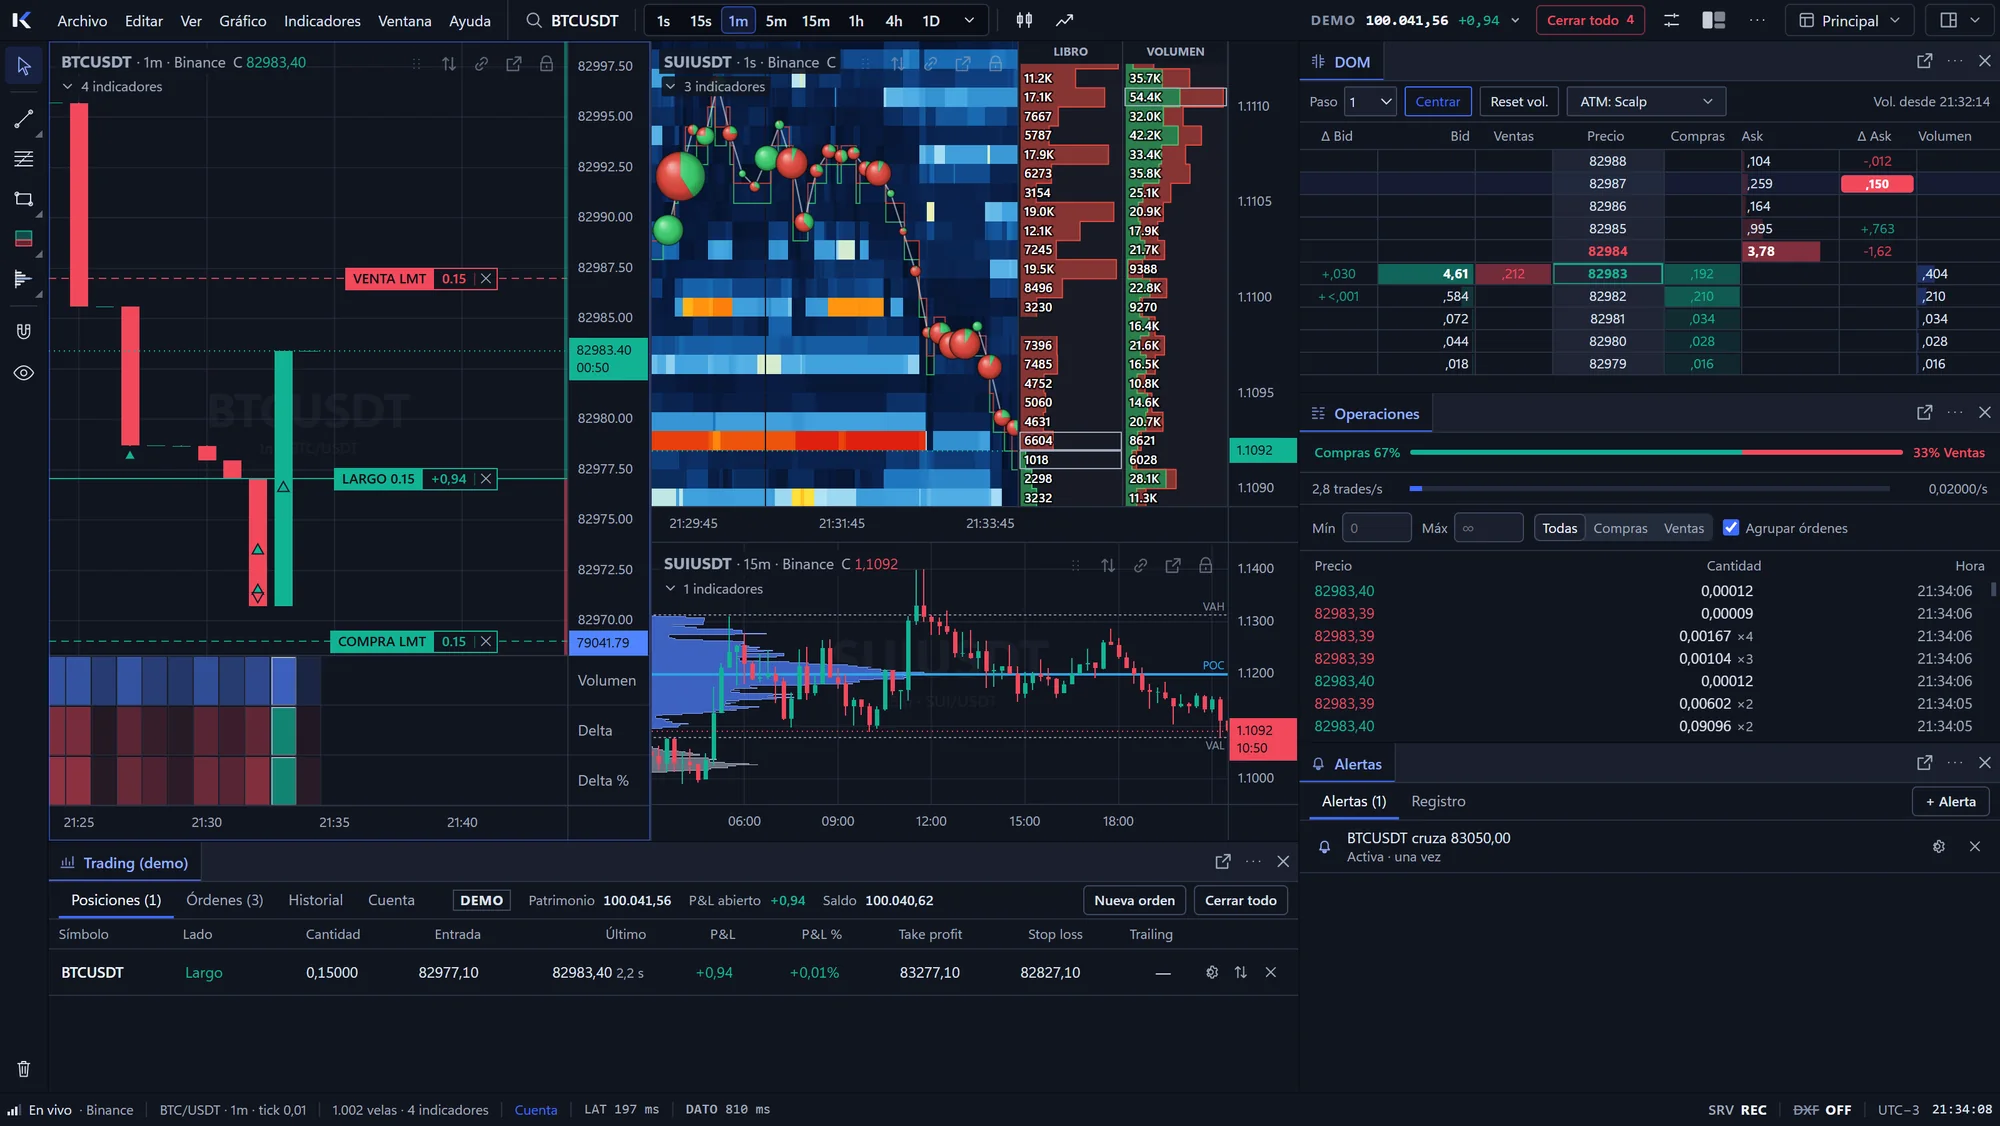
  • Orders on the chart
    Limits, stops, take profit and your position with live P&L, as draggable lines. Fills stay marked on the candle where they happened.
  • Full station
    Charts, DOM, time & sales, alerts and account in dockable panels, each with its own floating window if you need it.
  • DOM and smart tape
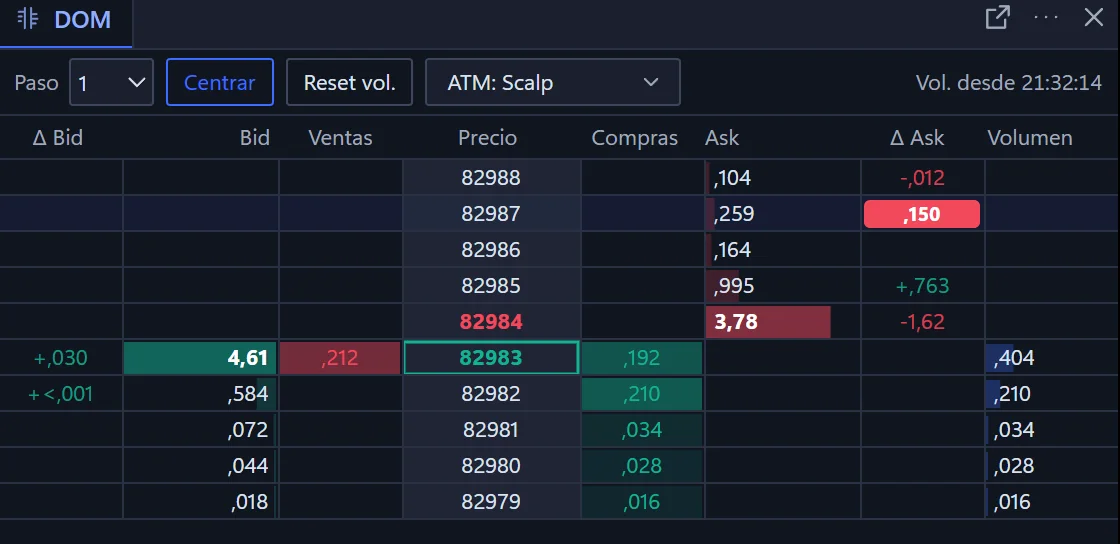
    Price ladder with bid, ask, traded volume and book changes per level; the tape groups orders and splits buys from sells.
  • ATM strategies
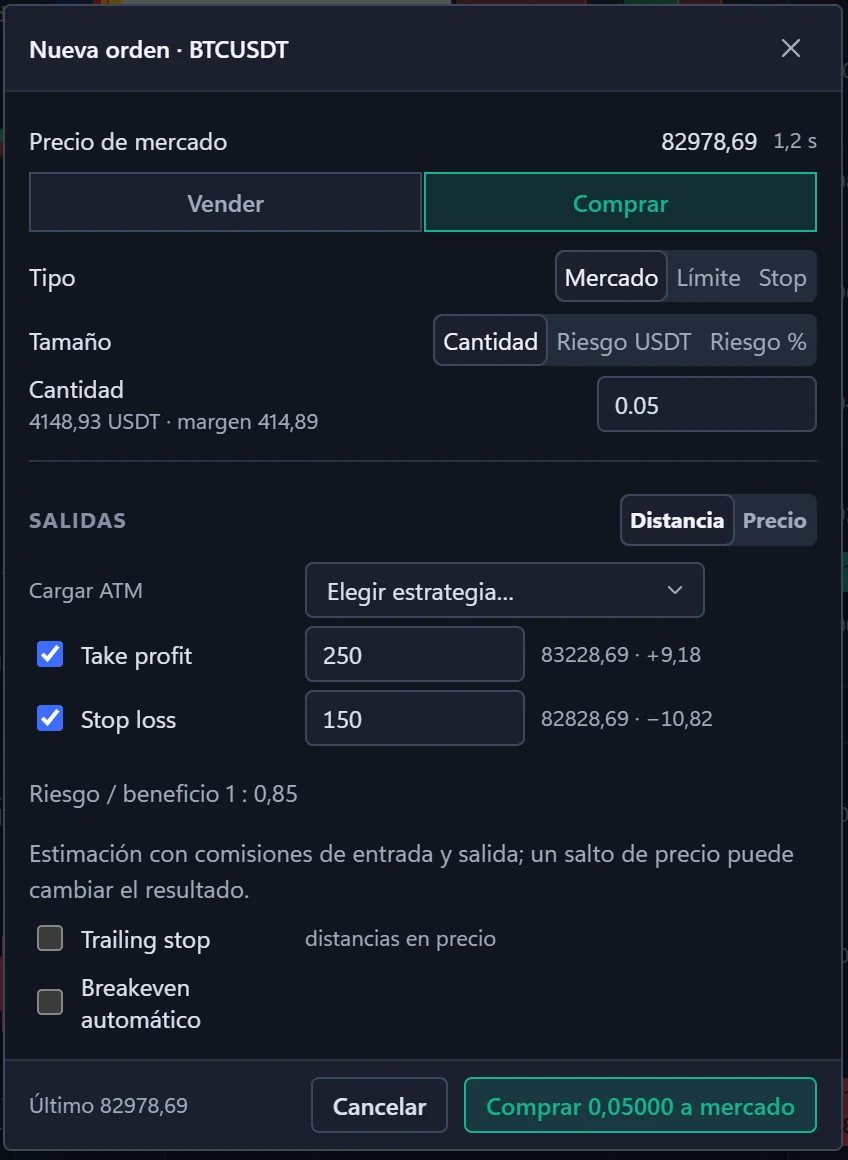
    Automatic take profit and stop loss on entry, with risk and reward computed before you send.
  • Scalp score
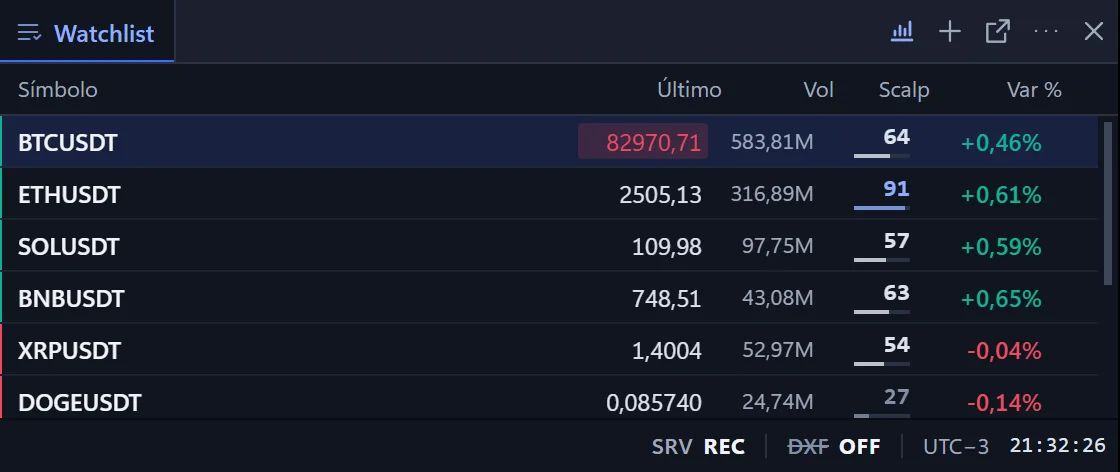
    The watchlist scores each symbol by volatility, volume and spread to find where the action is.
Trading (demo) · BTCUSDT
Chart with position and orders Full trading station DOM price ladder Order ticket with exits Watchlist with scalp score

Beyond the chart

Relive a session.
And measure whether your idea works.

Backtester with tick replay
Backtester

Tick-by-tick replay

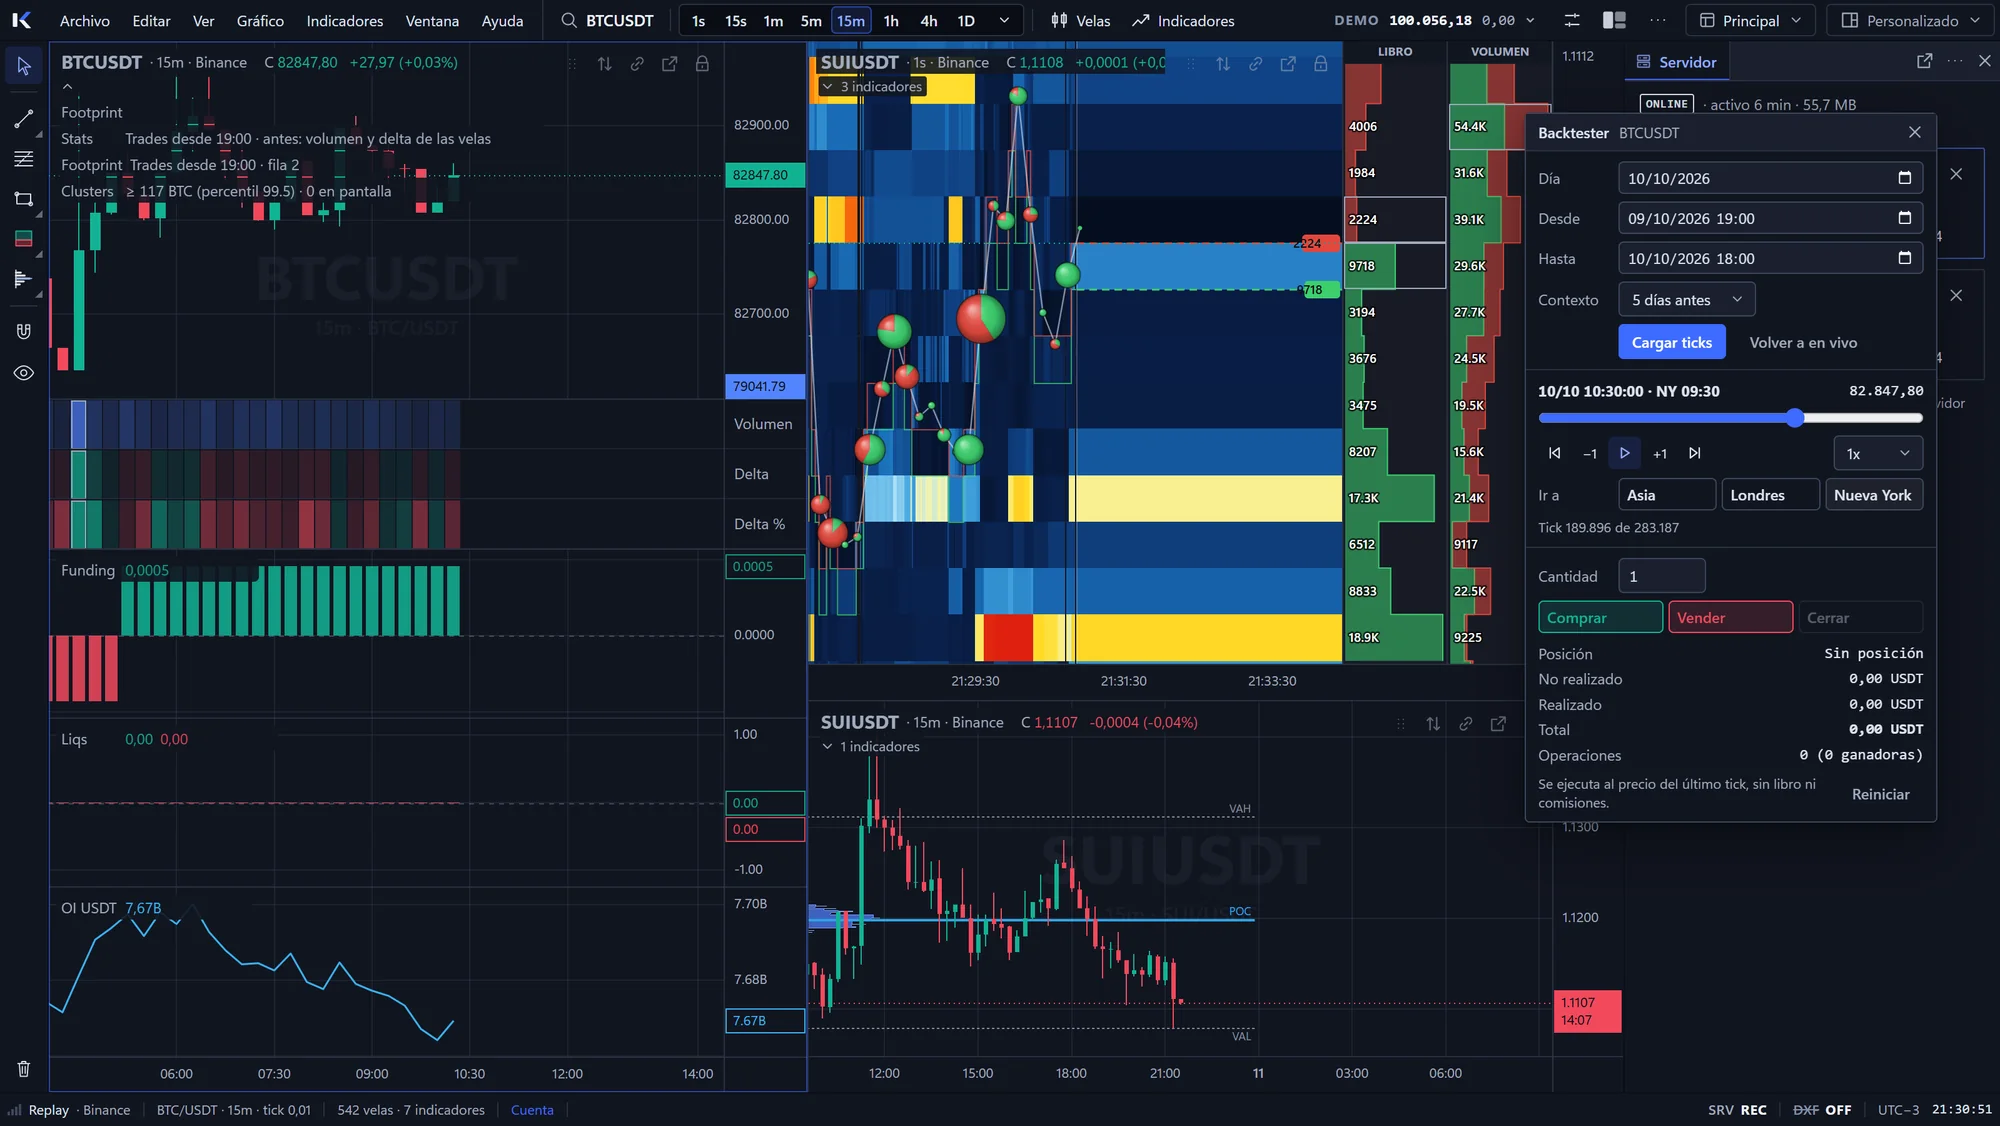
Load a full trading day and replay it from 1x to 128x on every chart at once: footprint, profiles and signals rebuild with each tick. Jump to the Asia, London or New York open and trade with simulated P&L.
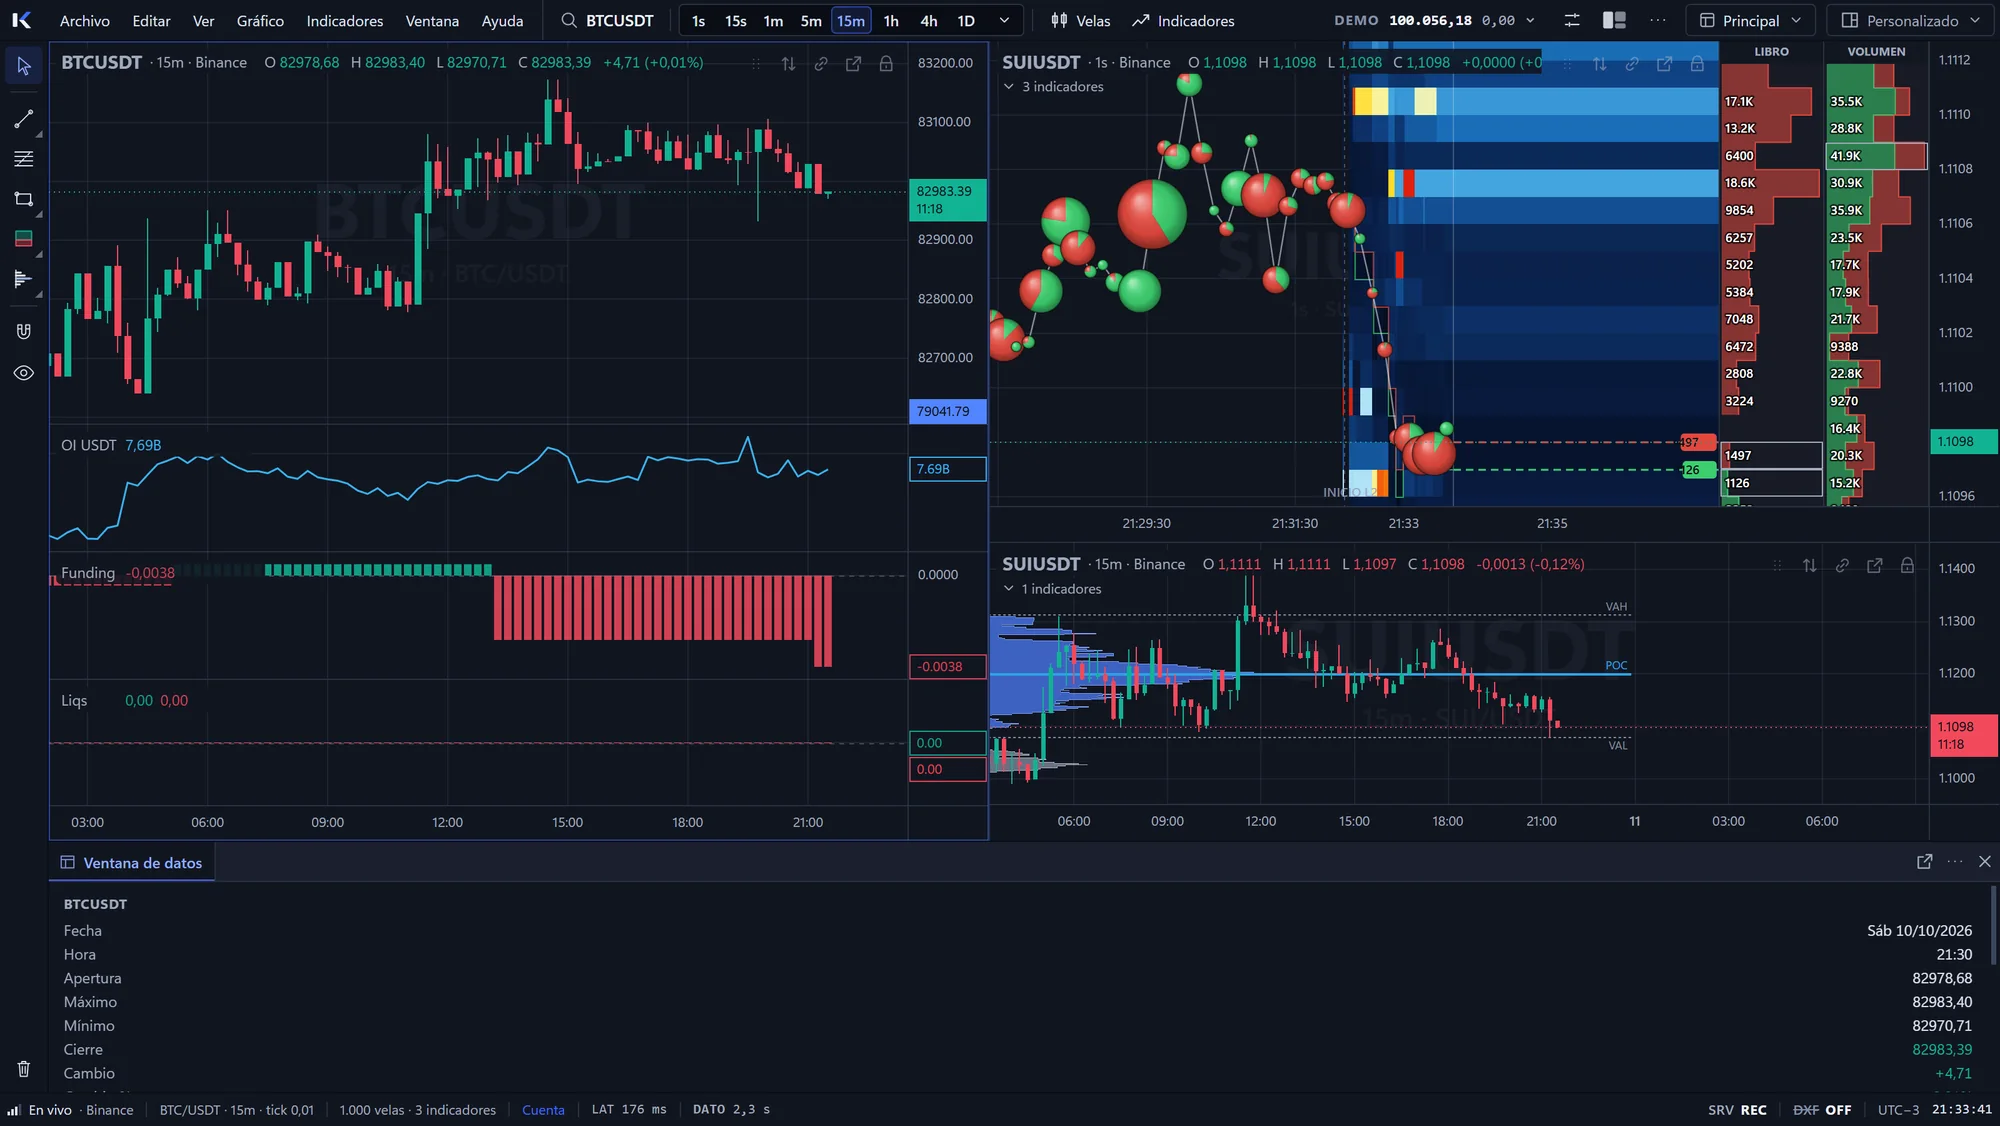
Open interest, funding and liquidations
Derivatives

OI, funding and liquidations

Perpetual futures context, Velo and Exocharts style, under the price.
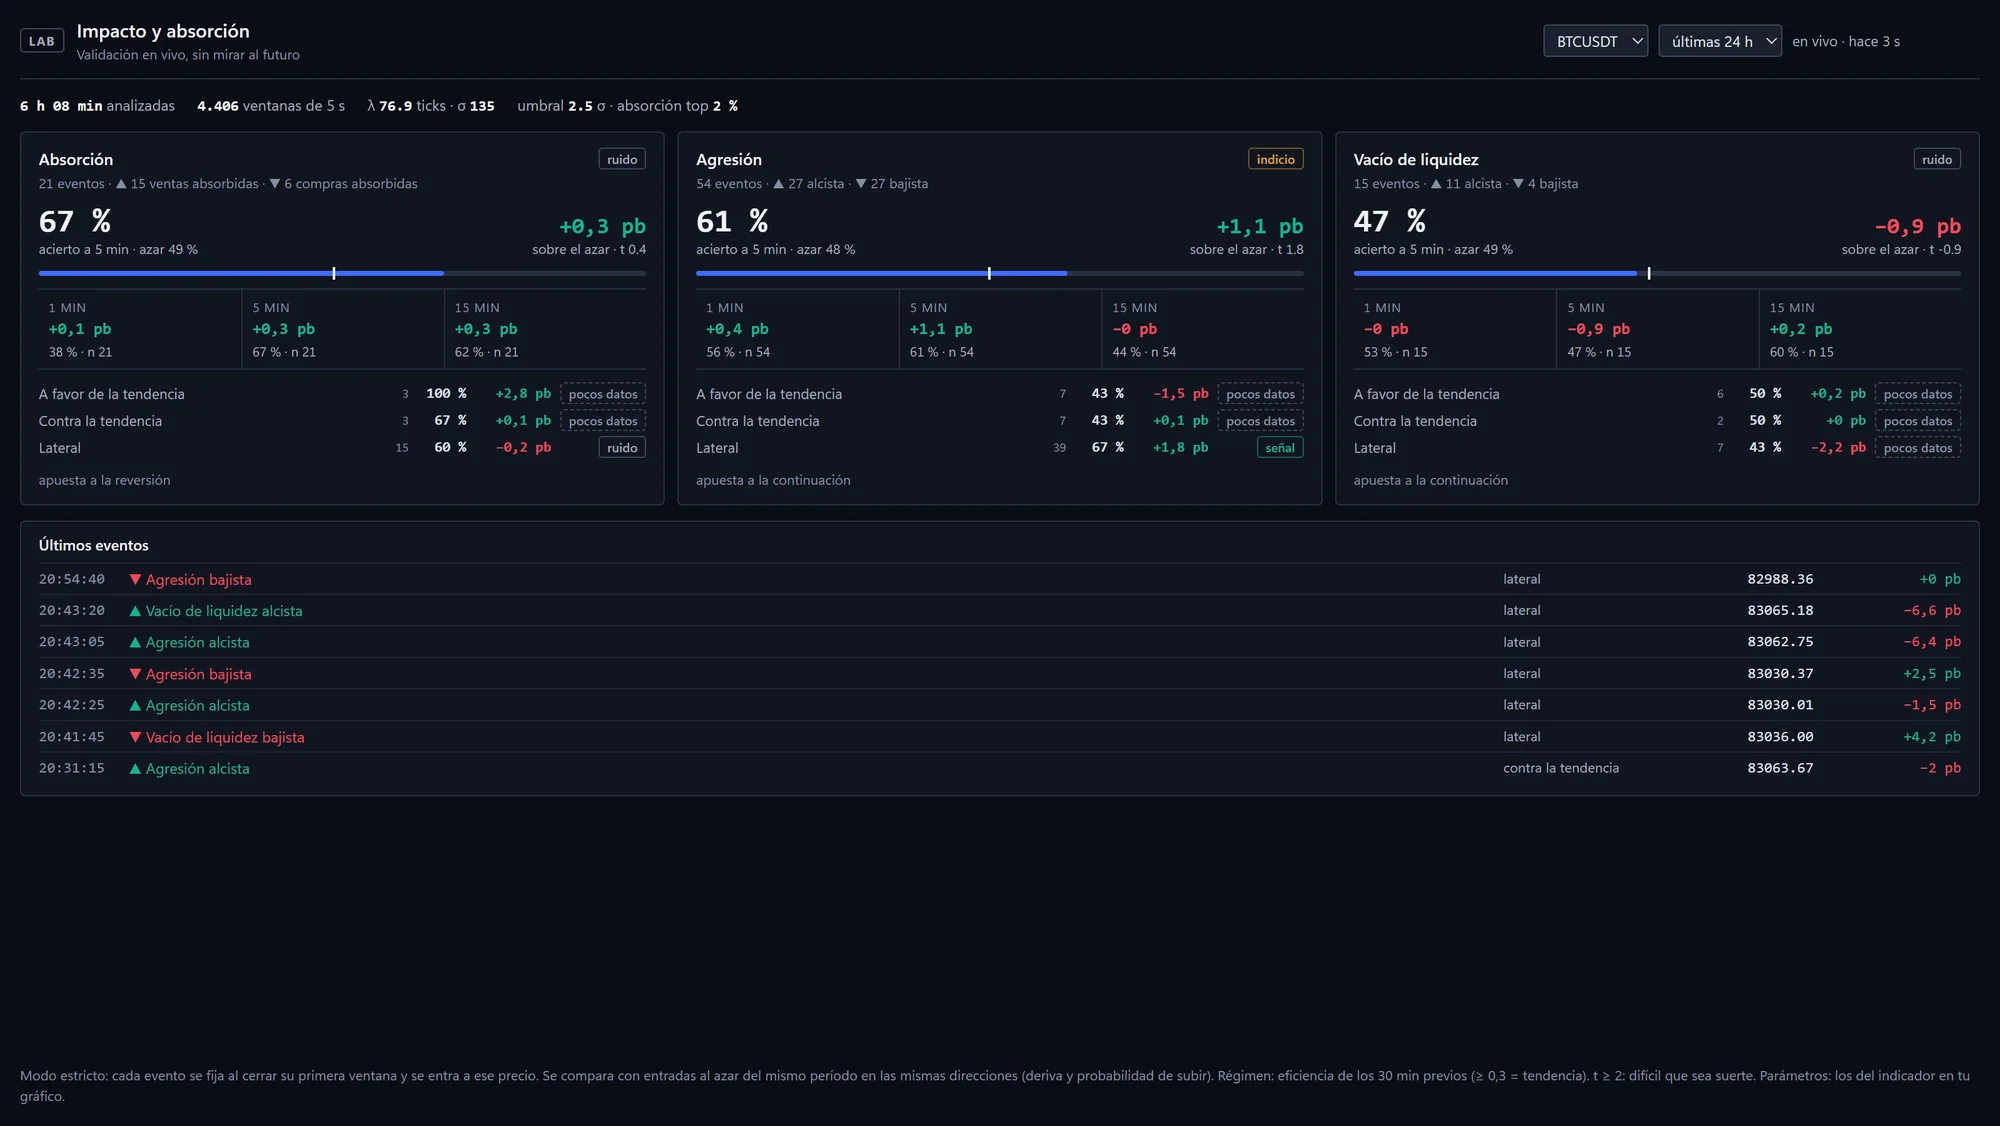
Impact and absorption LAB
LAB

Signals that audit themselves

Absorption, aggression and liquidity voids measured against random entries, with their t-statistic. If it’s noise, Kairos tells you.
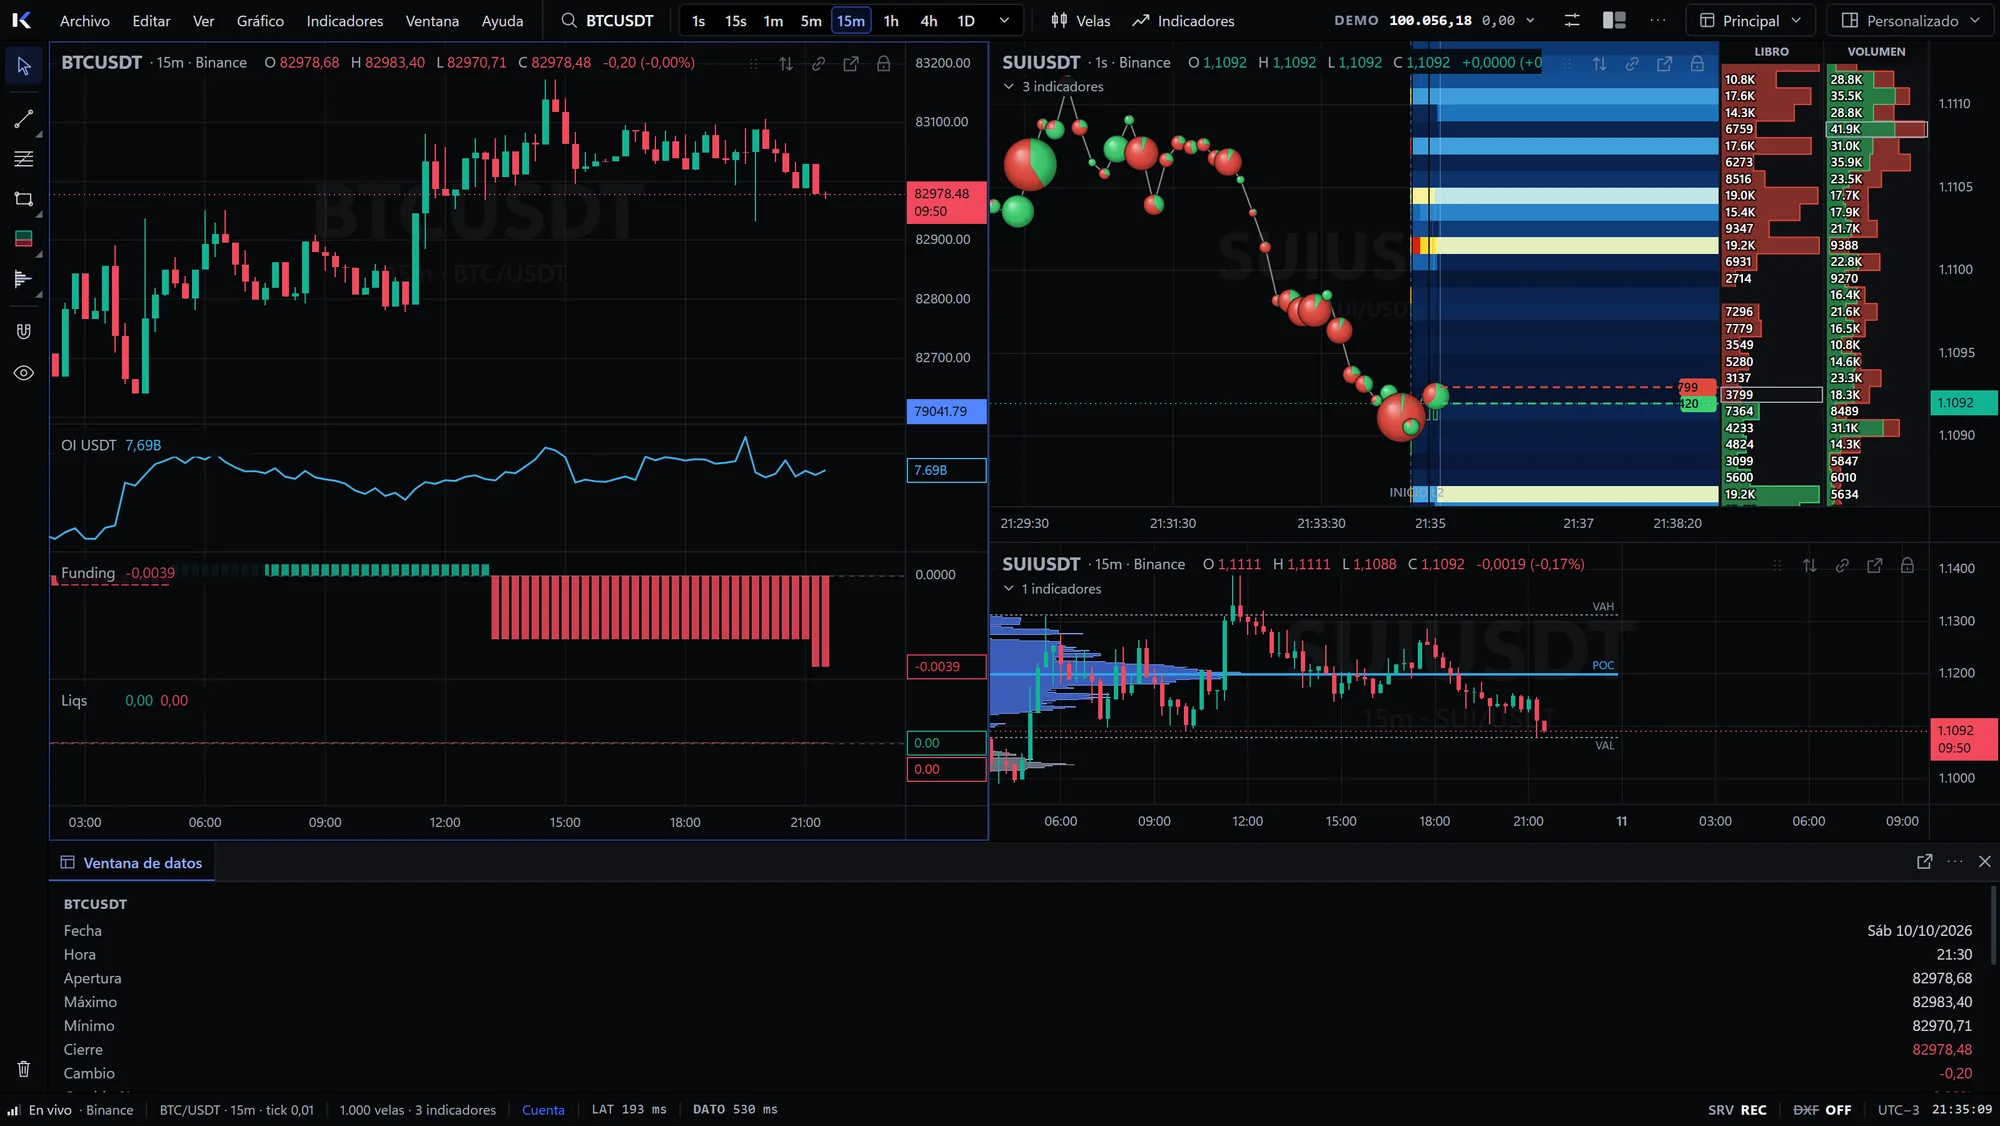
Midnight theme
Your own server

Your history, on your disk

A local server records trades and the L2 book in hourly files, with configurable retention, and serves them to every chart. No data vendor required.
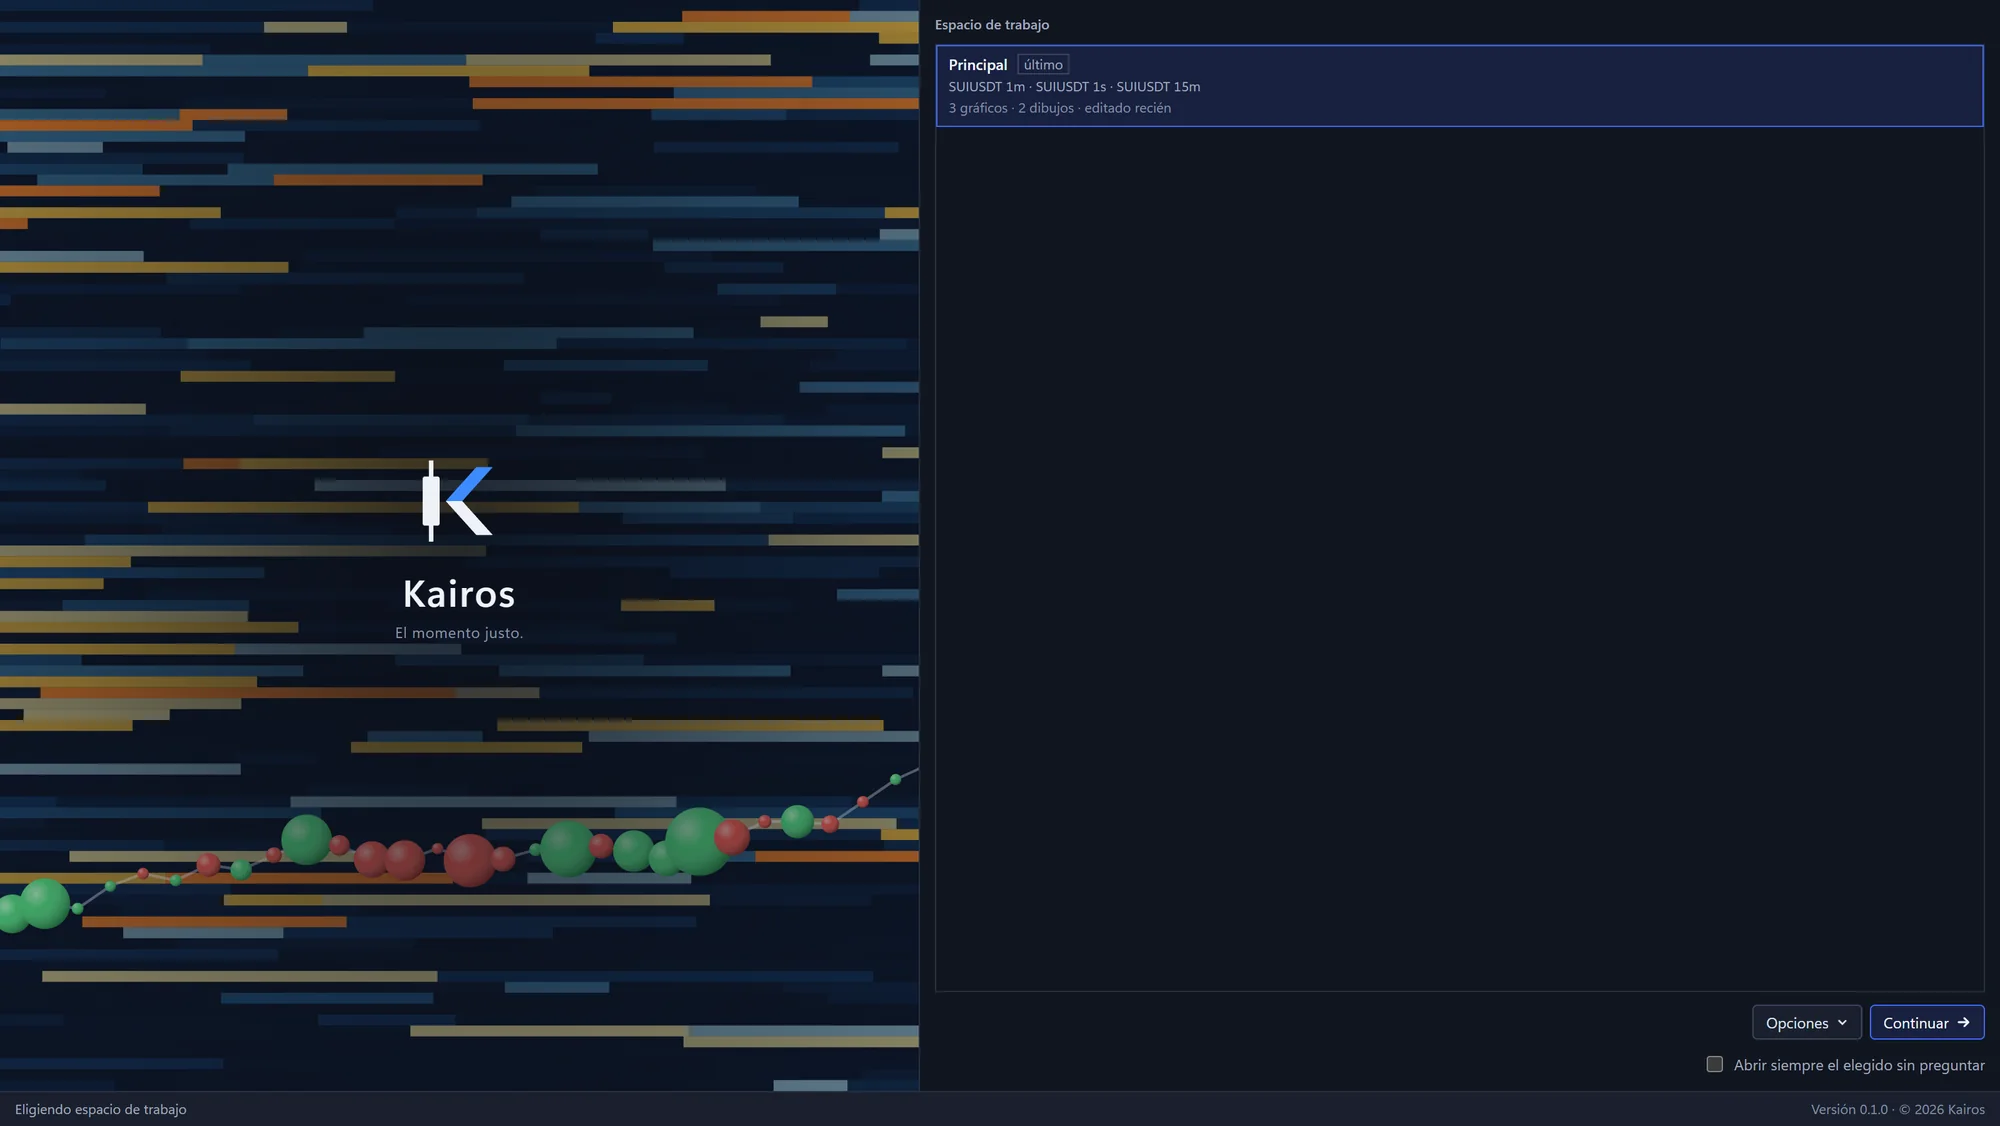
Kairos start screen
Desktop

Native Windows app

Frameless window, panels you can pop out to other monitors, keyboard shortcuts and dense menus. A terminal, not a web page.

Under the hood

Terminal engineering,
not web page engineering.

For those who want to know how it’s built: every layer is designed so the chart never waits for data, and data never waits for the chart.

Binance REST: 5,000-level snapshot WS: depth@100ms · trades no keys CME futures dxFeed · Rithmic candles, trades and depth optional Local server (Node) Manages orders, positions and ATM strategies Market history and alerts Syncs workspaces across windows and charts orders · history · alerts Local API at /api DESKTOP APP · ELECTRON + REACT RecorderHub one recording per symbol, shared across charts ChartController one per chart: bars, layers, view and drawings ChartEngine Pure TypeScript, no React Scales: bar index and linear / log price Render: 2 canvases, scene and overlay, with invalidation Layers: heatmap, footprint, big trades, profiles…

A gap-free synced book

REST snapshot + WebSocket diffs: stale ones are dropped, the first must cover lastUpdateId+1 and ids must be contiguous. Any gap triggers an automatic resync.

X axis in bar indices

Time isn’t drawn as time: each bar is an index. No weekend gaps, stable zoom, and drawings anchored at (time, price) that survive any interval.

Layered rendering

Scene and overlay on separate canvases. Moving the mouse only repaints the overlay; the heatmap rebuilds only when data, range or scale change.

O(1) queries per row

Each candle averages the book frames in its range with prefix sums, and closed ranges are cached. Changing the interval doesn’t recompute recorded history.

Pure indicators

Each study is a bars → series function with declarative metadata. Testable one by one and ready to move to a Web Worker.

src/indicators/registry.tsdeclarative
// An indicator = metadata + a pure function.
{
  type: 'rvol',
  name: 'Volumen relativo',
  category: 'volume',
  overlay: false,
  params: [{ id: 'len', type: 'number', min: 2, def: 20 }],
  plots: [{ id: 'rvol', kind: 'histogram' }],
  levels: [1, 2],
  compute(bars, { len }) { /* bars → series */ },
}
Heatmap · color scaleanchored to what’s visible
// Same balance on any symbol and zoom:
const a = pct(visible, 0.50)   // typical liquidity → blue
const b = pct(visible, 0.90)   // → light blue
const c = pct(visible, 0.995)  // walls → red

// log interpolation between anchors,
// smoothed between rebuilds:
// no flicker with each live sample.
anchors.lerp({ a, b, c }, 0.08)
Kairos
In development · v0.5

The right moment
hasn’t arrived yet.

Kairos is in active development. Join the waitlist and get in before everyone else.

  • Free trial before the public launch
  • Lifetime discount for everyone on the waitlist

For Windows 10/11 x64 · Binance with no account · Paper trading included

kairos — status